Category: Cryptocurrency News

Cryptocurrency News and Public Mining Pools

A lesson / warning on exchanges, KYC and sudden account closures

We’ve all seen the posts – “exchange abc why did you close my account for no reason?” I’ve always wondered why. “They have violated the ToS the exchange might say. But we never actually know. I learned a little bit of insight today and I thought it was important to share. Not going to name…
Read more

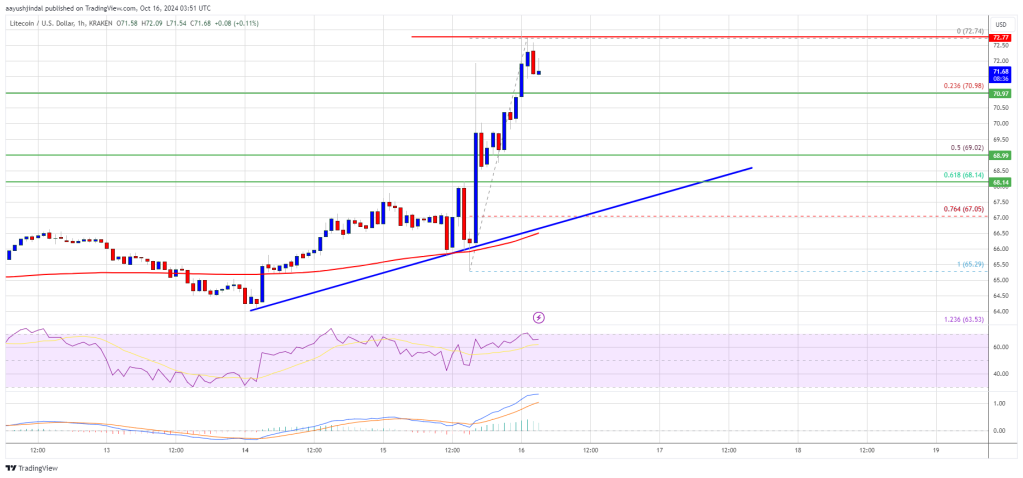
Litecoin (LTC) Jumps 10%: Can the Bulls Fuel a Bigger Rally?

Litecoin price is gaining pace above the $70.00 level against the US Dollar. LTC could continue to rise if it clears the $72.80 resistance zone. Litecoin is showing positive signs from the $65 support zone against the US Dollar. The price is now trading above $70 and the 100-hourly Simple Moving Average. There is a key bullish trend line forming with support at $68.00 on the hourly chart of the LTC/USD pair (data feed from Kraken). The price is up over 10% and might continue to rise if it clears the $72.80 resistance zone. Litecoin Price Gains Bullish Momentum After forming a base above $65, Litecoin started a fresh increase. LTC price broke the $68 and $70 resistance levels to move into a positive zone, like Bitcoin and Ethereum. The price gained over 10% and even cleared the $72 level. A high was formed at $72.74 and the price is now consolidating gains. It is stable above the 23.6% Fib retracement level of the upward move from the $65.29 swing low to the $72.74 high. Litecoin is now trading above $70 and the 100 simple moving average (4 hours). There is also a key bullish trend line forming with support at $68.00 on the hourly chart of the LTC/USD pair. The trend line is close to the 61.8% Fib retracement level of the upward move from the $65.29 swing low to the $72.74 high. On the upside, immediate resistance is near the $72.00 zone. The next major resistance is near the $72.80 level. If there is a clear break above the $72.80 resistance, the price could start another strong increase. In the stated case, the price is likely to continue higher toward the $75.50 and $78.00 levels. Any more gains might send LTC’s price toward the $80.00 resistance zone. Are Dips Supported in LTC? If Litecoin price fails to clear the $72 resistance level, there could be a downside correction. Initial support on the downside is near the $71.00 level. The next major support is forming near the $69.00 level, below which there is a risk of a move toward the $67.50 support. Any further losses may perhaps send the price toward the $65.00 support. Technical indicators: Hourly MACD – The MACD is now gaining pace in the bullish zone. Hourly RSI (Relative Strength Index) – The RSI for LTC/USD is above the 60 level. Major Support Levels – $71.00 followed by $67.50. Major Resistance Levels – $72.80 and $80.00.

As Bitcoin Tops $66K, Fear & Greed Index Moves To Neutral—What’s Next?

Analysts observed that the number of Bitcoin active addresses is unaffected by the fluctuating sentiments around the most popular cryptocurrency, saying it remains remarkably stable. This, as the alpha coin breaches the $66,000 level at the time of writing. Active address count monitors the number of unique Bitcoin addresses that have been involved in a transaction during a given period. This metric is viewed as an essential indicator of the digital asset’s health and adoption. Related Reading: Dogecoin Revival: Active Addresses Skyrocket To Highest Level In 8 Months According to Santiment, the seven-day average of about 3.5 million active addresses indicates that the digital coin’s key yardstick remained strong, unmoved by the neutral sentiment recorded for the Bitcoin fear and greed barometer. This despite the price of Bitcoin undergoing all that volatility associated with crypto markets, the count of active addresses stood firm, showing that core users and participants continue actively using the cryptocurrency for their transactions and holdings. Still, Active Addresses Are Somewhat Below Yearly Average Active addresses have been relatively static over the last few days, and its 2024 monthly average hasn’t yet overcome the yearly average, so engagements are down. It was found by Glassnode to be in parallel with the slide seen mid-2018 during the Bitcoin price correction after its bull run of 2017. Although prices have rallied briefly, network activity has not returned in a manner consistent with past cycles. The decline in active addresses and the post-halving period of this year point to a declining need for blockspace by the network, which could be a sign of a wider slowdown in the number of Bitcoin users. A Positive Long-Term Outlook? Analysts pointed out that the consistent network activity would suggest that the long-term prognosis for the asset related to cryptocurrencies stays favorable. It also demonstrated how the basic usage and interaction with the Bitcoin network have not been impacted by the swings in the digital currency environment of speculative investments. Independent of the enthusiasm or fear that could drive temporary price changes, the persistence of the active address count indicates a fundamental robustness of Bitcoin’s infrastructure and the actual real-world benefit it offers. Related Reading: Brace For Impact: XRP Primed For Massive ‘Explosion,’ Analyst Says After Key Break Sentiment On Bitcoin Stabilizing After the market sentiment experienced highs and lows in the past few days, the Bitcoin fear and greed index revealed that sentiment has found its way in the neutral zone. At the time of writing, the fear and greed index was at 48, a sign of a market in equilibrium. It also signaled the shift to neutral courtesy of the increased anxiety and greed brought on by changing prices. Based on various criteria including volatility, volume, and social media trends, the Bitcoin fear and greed index suggests that following the recent strong market swings investors are adopting a wait-and-see strategy before jumping in and investing. Featured image from Pexels, chart from TradingView
Over 90% of Salvadorans don’t transact with Bitcoin: Survey

Salvadorans have expressed approval of President Nayib Bukele, but they’ve not exactly warmed to his adoption of Bitcoin as legal tender.

Tesla Relocates $760M Worth of Bitcoin, While Spacex Funds Remain Untouched

On Oct. 15, 2024, Tesla initiated a transaction, transferring 1,800 BTC at precisely 5:03 p.m. EDT at block height 865,811. Following this initial move, the company shifted a grand total of 11,509 BTC, valued at more than $760 million, from its well-known wallets. At this time, it’s suspected that the funds have been relocated to […]

Congress lacking crypto education will lead to ‘bad laws’ — Coinbase CSO

Phillip Martin told Cointelegraph that Coinbase has focused on educating lawmakers on crypto as they “make much better decisions” on regulation.

XRP Price Nearing Breakout: Can It Finally Push Higher?

XRP price is moving higher above the $0.5400 zone. The price must settle above the $0.5550 resistance to set the pace for a larger increase. XRP price is attempting a fresh increase above the $0.540 zone. The price is now trading above $0.5410 and the 100-hourly Simple Moving Average. There is a key bullish trend line forming with support at $0.5395 on the hourly chart of the XRP/USD pair (data source from Kraken). The pair could gain bullish momentum if it clears the $0.550 and $0.5550 resistance levels. XRP Price Revisits Resistance XRP price started a downside correction from the $0.5550 resistance zone. There was a move below the $0.5420 support. However, the bulls were active at $0.5320. A low was formed at $0.5317 and the price is now rising like Bitcoin and Ethereum. The price climbed above the $0.5380 and $0.540 resistance levels. There was a move above the 50% Fib retracement level of the downward move from the $0.5550 swing high to the $0.5317 low. The price is now trading above $0.540 and the 100-hourly Simple Moving Average. There is also a key bullish trend line forming with support at $0.5395 on the hourly chart of the XRP/USD pair. On the upside, the price might face resistance near the $0.5460 level or the 61.8% Fib retracement level of the downward move from the $0.5550 swing high to the $0.5317 low. The first major resistance is near the $0.5500 level. The next key resistance could be $0.5550. A clear move above the $0.5550 resistance might send the price toward the $0.5650 resistance. Any more gains might send the price toward the $0.5800 resistance or even $0.5880 in the near term. The next major hurdle might be $0.6000. Another Decline? If XRP fails to clear the $0.550 resistance zone, it could start another decline. Initial support on the downside is near the $0.540 level and the trend line. The next major support is near the $0.5320 level. If there is a downside break and a close below the $0.5320 level, the price might continue to decline toward the $0.5210 support in the near term. The next major support sits near the $0.5050 zone. Technical Indicators Hourly MACD – The MACD for XRP/USD is now gaining pace in the bullish zone. Hourly RSI (Relative Strength Index) – The RSI for XRP/USD is now above the 50 level. Major Support Levels – $0.5400 and $0.5320. Major Resistance Levels – $0.5500 and $0.5550.

Praxis gets $525M for utopic crypto, AI-friendly city

Praxis, a self-described internet-native alliance, said it received $525 million in funding to build a lesser-regulated tech-friendly city. 

Newbie wondering about patterns.

I’ve noticed in the few crypto’s I’m watching that during normal stock trading hours, crypto’s price seem to go down. And after hours it goes up. I’m assuming that this is due to an addiction from traders who need to trade 24/7. I’m probably wrong, but I’ve had some success buying in mid afternoon and…
Read more

World’s largest asset manager BlackRock holds $24 billion in Bitcoin

submitted by /u/Abdeliq [link] [comments]