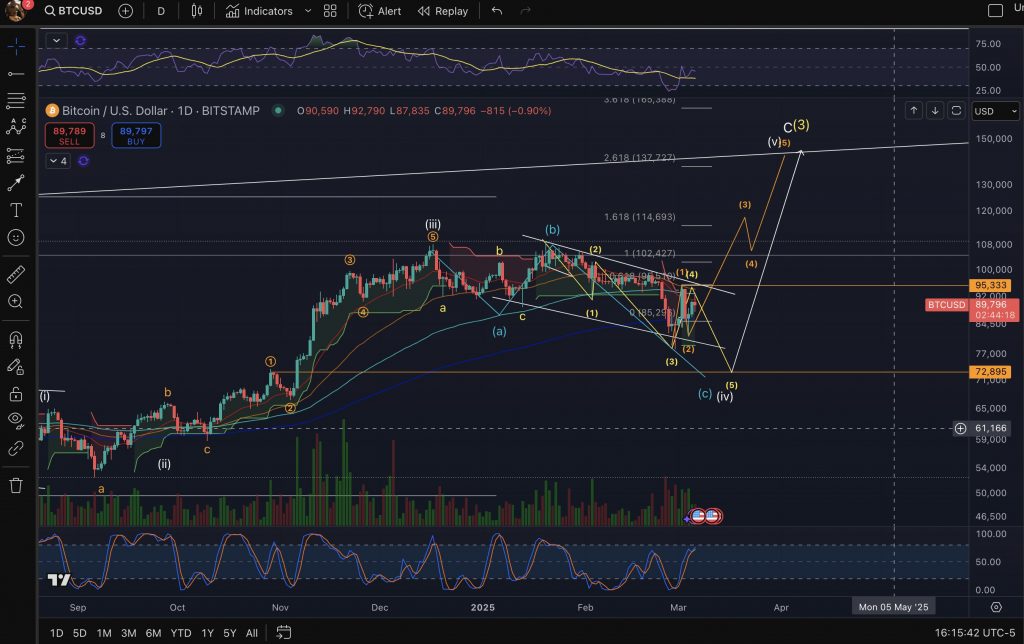
Category: Cryptocurrency News

Cryptocurrency News and Public Mining Pools

Bitcoin Price Attempts a Comeback—Is a Recovery Rally on the Horizon?

Bitcoin price started a recovery wave from the $82,000 zone. BTC is back above $88,500 and might revisit the $95,000 resistance zone. Bitcoin started a fresh upward move from the $82,000 zone. The price is trading above $90,000 and the 100 hourly Simple moving average. There was a break above a connecting bearish trend line with resistance at $90,000 on the hourly chart of the BTC/USD pair (data feed from Kraken). The pair could start another decline if it fails to clear the $95,000 resistance zone. Bitcoin Price Starts Recovery Bitcoin price started a fresh decline below the $92,000 level. BTC traded below the $90,000 and $88,000 support levels. Finally, the price tested the $82,000 support zone. A low was formed at $81,434 and the price recently started a recovery wave. There was a move above the $85,000 and $88,000 resistance levels. The bulls pushed the price above the 50% Fib retracement level of the downward move from the $95,000 resistance to the $81,434 low. There was also a break above a connecting bearish trend line with resistance at $90,000 on the hourly chart of the BTC/USD pair. Bitcoin price is now trading above $90,000 and the 100 hourly Simple moving average. On the upside, immediate resistance is near the $91,800 level or the 76.4% Fib retracement level of the downward move from the $95,000 resistance to the $81,434 low. The first key resistance is near the $92,500 level. The next key resistance could be $93,500. A close above the $93,500 resistance might send the price further higher. In the stated case, the price could rise and test the $95,000 resistance level. Any more gains might send the price toward the $96,200 level or even $98,000. Another Decline In BTC? If Bitcoin fails to rise above the $92,000 resistance zone, it could start a fresh decline. Immediate support on the downside is near the $88,000 level. The first major support is near the $86,200 level. The next support is now near the $85,000 zone. Any more losses might send the price toward the $82,000 support in the near term. The main support sits at $80,000. Technical indicators: Hourly MACD – The MACD is now gaining pace in the bullish zone. Hourly RSI (Relative Strength Index) – The RSI for BTC/USD is now above the 50 level. Major Support Levels – $88,000, followed by $85,000. Major Resistance Levels – $92,000 and $93,500.

Ripple Backs National Crypto Initiative With $50M as US Adoption Accelerates

Ripple is backing crypto’s mainstream rise with a $50 million grant to the National Cryptocurrency Association, fueling education and real-world adoption across the U.S. National Cryptocurrency Association Kicks off With $50M From Ripple to Fuel US Crypto Growth The National Cryptocurrency Association (NCA), a new initiative aimed at increasing cryptocurrency literacy across the United States, […]

Trump’s crypto reserve likely to be mostly Bitcoin, bigger than expected: Bitwise

Bitwise investment chief Matt Hougan says Trump’s crypto reserve announcement should be seen as bullish and that the market is “misreading things.”

Trump’s crypto reserve likely to be mostly Bitcoin, bigger than expected: Bitwise

Bitwise investment chief Matt Hougan says Trump’s crypto reserve announcement should be seen as bullish and that the market is “misreading things.”

Trump’s crypto reserve likely to be mostly Bitcoin, bigger than expected: Bitwise

Bitwise investment chief Matt Hougan says Trump’s crypto reserve announcement should be seen as bullish and that the market is “misreading things.”

Mt Gox Awakens: $1 Billion in Bitcoin Quietly Shifts to an Unknown Wallet

According to Arkham Intelligence and onchain analytics, custodians overseeing Mt Gox’s bitcoin holdings have transferred 11,833.64 BTC, valued at over $1 billion based on prevailing bitcoin prices. The substantial bitcoin (BTC) transaction occurred Wednesday at block height 886,484, involving precisely 11,833.64 BTC, equating to roughly $1.066 billion. Arkham promptly informed the crypto community via X […]

PEPE Price: Analyst Says Watch This Level To Trigger 400% Move Toward $0.0001

Meme coin PEPE has been hovering near a crucial support level over the past few weeks, following a sustained decline that began at the start of the year. Interestingly, a crypto analyst on TradingView has highlighted this price support as a make-or-break level for PEPE, suggesting that a breakout above this zone could spark a 400% rally toward $0.0001. This outlook comes after a particularly challenging week for the entire crypto market, during which PEPE extended its losses and dropped to its lowest price point in months. This Level To Trigger 400% Move For PEPE Technical analysis shows that PEPE’s upward trajectory hinges on a bounce at support around $0.00000650. This interesting analysis was highlighted by a crypto analyst on the TradingView platform using the PEPE weekly candlestick timeframe chart.  Related Reading: PEPE Marks Bottom After Scary Market Crash, Enters Wave 3 With Over 500% Promise This support level comes into play in light of PEPE’s extended decline since the beginning of the year. Interestingly, technical analysis shows that the decline looks like a repeating pattern of the meme coin’s price action in 2024. The ongoing correction stems from PEPE’s peak price of $0.00002803 in December 2024, which the analyst termed the third drive. Notably, earlier first and second drives in 2024 were also each accompanied by a correction phase after rallies. Interestingly, the meme coin has shown signs of life in the past 24 hours with a push above this support level and climbing into the $0.000007 range. However, the uptrend could not be defined yet, and the crypto analyst noted that any uptrend will depend on how PEPE reacts with a crucial resistance zone between $0.00001150 and $0.00001200.  This level has previously acted as support but has now turned into resistance. Therefore, a weekly close above this zone would confirm a bullish breakout and a potential trend reversal from bearish to bullish. Price Targets If The Meme Coin Breaks Above Resistance A break above $0.00001200 would cement a breakout with more momentum for PEPE. Such a breakout would mark the first bullish catalyst in a while, confirm momentum, and lead to increased buy-side pressure with an aggressive upward move. From here, the next resistance levels are projected to be around $0.00001700 to $0.00002200. A move to $0.00002200 will most likely cascade into more momentum above its current all-time high of $0.00002803.  Related Reading: PEPE Flashes Reversal Signal To Recoup The 800 EMA, What This Means For Price The analyst further predicted a price target of $0.0001, provided the bullish momentum sustains itself. However, failure to close above the key resistance level at $0.00001200 could result in a continued downtrend, with PEPE possibly retesting lower support zones around $0.00000650 to $0.00000550. At the time of writing, PEPE is trading at $0.000007239, up by 4.4% in the past 24 hours. PEPE’s ability to sustain such an upward trajectory would depend on broader market conditions for Bitcoin and other large market cap cryptocurrencies. Featured image from Adobe Stock, chart from Tradingview.com

US Customs has started releasing seized crypto miners: Report

Thousands of crypto miners have started to move out from various US ports of entry after months of delay.

US Customs has started releasing seized crypto miners: Report

Thousands of crypto miners have started to move out from various US ports of entry after months of delay.

US Customs has started releasing seized crypto miners: Report

Thousands of crypto miners have started to move out from various US ports of entry after months of delay.