This Bitcoin Signal Aligns With Price Tops, CryptoQuant Analyst Reveals
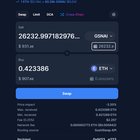
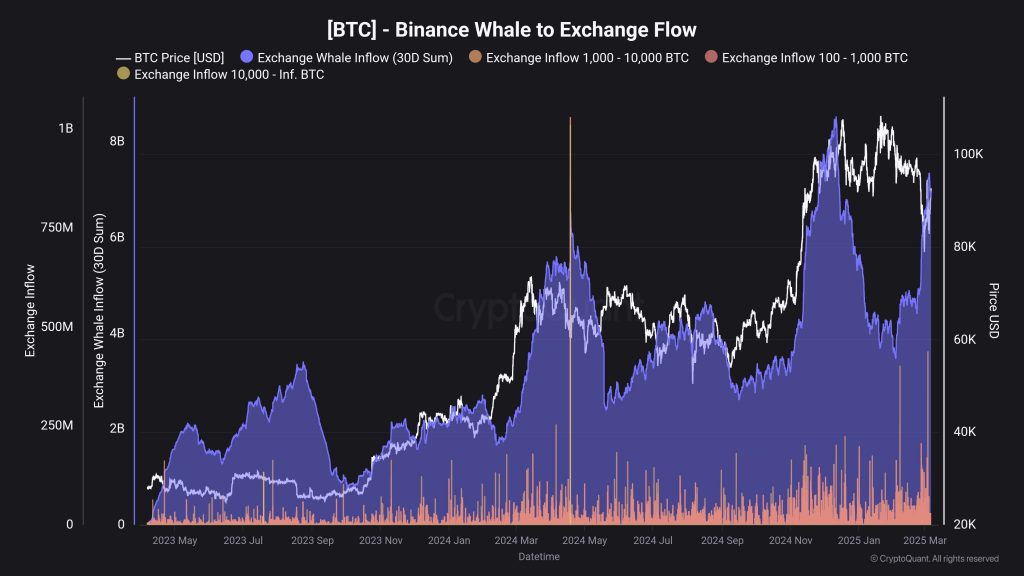
The community analyst at the on-chain analytics firm CryptoQuant has pointed out how this Bitcoin indicator has been aligning with price tops. Bitcoin Binance Whale To Exchange Flow Shows An Interesting Pattern In a new post on X, CryptoQuant community analyst Maartunn has talked about the trend in the Bitcoin Exchange Whale Inflow for the cryptocurrency exchange Binance. The “Exchange Whale Inflow” here refers to an on-chain metric that measures the total amount of the asset that the whale entities are transferring to a given centralized exchange. Related Reading: Bitcoin Bullish Signal: $900 Million In BTC Leaves Exchanges When the value of this indicator is high, it means the whales are depositing a large number of tokens to the platform. Such a trend can be a sign that these large entities are looking to sell, which can be a bearish sign for the asset’s price. On the other hand, the metric being low suggests this cohort may be accumulating or just not planning to distribute, which can naturally be a bullish sign for BTC. Now, here is the chart shared by the analyst, that shows the trend in the 30-day sum of the Bitcoin Exchange Whale Inflow for Binance over the last couple of months: As displayed in the above graph, the 30-day Bitcoin Exchange Whale Inflow for Binance has recently witnessed a sharp climb, which suggests large deposits to the platform have been on the rise. Maartunn has discovered a pattern related to what usually happens whenever the metric shows a trend like this one. From the chart, it’s visible that spikes in the indicator have come around tops in the cryptocurrency’s price. This relationship hasn’t been exact, but it’s true that BTC has witnessed some kind of peak shortly before or shortly after a strong surge in the Binance Exchange Whale Inflow. Related Reading: This Bitcoin Price Range Could Be The Bulls’ Final Defense Line, Report Says Whales are the largest of investors in the sector and Binance is the largest exchange, so it makes sense that the combined behavior related to the two would have noticeable implications for Bitcoin. Following the recent increase, the 30-day Binance Exchange Whale Inflow has reached a value of $7.3 billion, which is the highest that it has been in around three months. It now remains to be seen whether these high deposits would have a similar effect on the asset as before or not. BTC Price Bitcoin has continued to display volatility in both directions during the last few days as its price has been wobbling up and down, with neither bulls nor bears gaining control. At present, the asset is trading around $89,500. Featured image from Dall-E, CryptoQuant.com, chart from TradingView.com