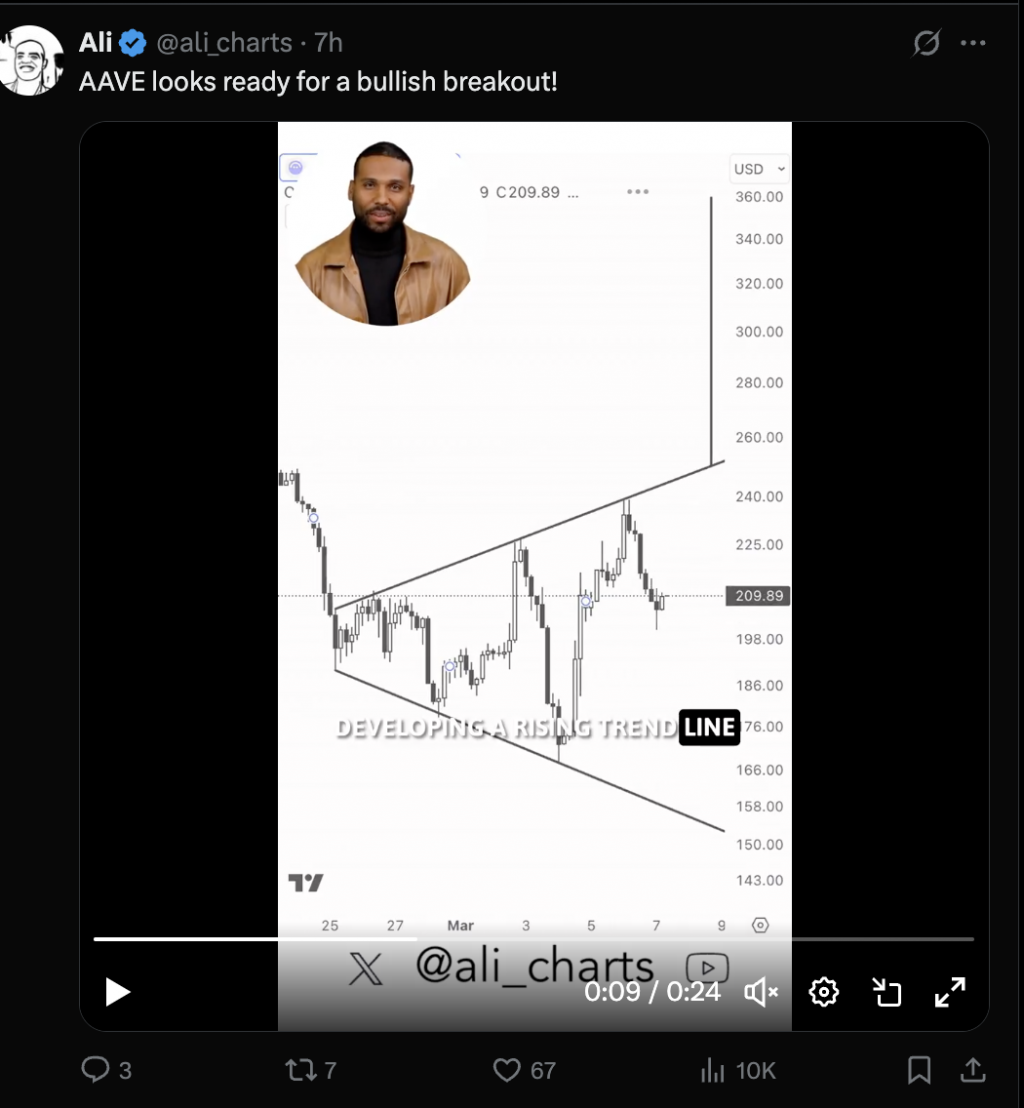
Category: Cryptocurrency News

Cryptocurrency News and Public Mining Pools

Shiba Inu Hits Make-Or-Break Price: 250% Rally Or New All-Time Low?

Shiba Inu (SHIB) is in a crucial make-or-break moment. Following a market-wide altcoin slump, SHIB’s price action is being shaped by two opposing chart patterns, both of which could have significant implications for the price’s future. A Tale Of Two Patterns For Shiba Inu The 1-week chart for SHIB reveals a tale of two patterns. On one hand, there’s the bullish triple bottom, suggesting a potential end to SHIB’s two-year downtrend. On the other, a descending triangle, which has been in the making for over 13 months, hints at a bearish outcome. In an analysis on August 30, NewsBTC already warned of this scenario. Related Reading: Shiba Inu Community Sounds Warning Alarm As Scammers Siege Shibarium Yesterday, SHIB’s price dipped to a low of $0.00000697 before rebounding slightly to $0.00000722. This places it precariously above the crucial support line of $0.00000715. For SHIB to steer clear of the bearish implications of the descending triangle and to validate the triple bottom, it’s imperative that it maintains a weekly close above this price. The triple bottom, a bullish chart pattern, is characterized by three roughly equivalent lows bouncing off a support level, culminating in a breakout above resistance. This suggests a shift in momentum from sellers to buyers. For SHIB, the criteria for a triple bottom seem to be in place: an existing downward trend precedes the pattern; the three lows are approximately equal, allowing for a horizontal trend line and a decline in volume throughout the pattern suggests weakening bearish momentum. SHIB’s journey through this pattern began in June 2022 with its first low at $0.00000715. After a brief recovery, it hit its second low in December 2021 at $0.00000781. The third and most recent low was recorded in June 2023 at $0.0000060. The Shadow Of The Descending Triangle However, the triple bottom’s bullish narrative is challenged by the descending triangle’s bearish undertones. If SHIB’s price falls below the $0.00000715 support, it could validate the descending triangle, potentially pushing SHIB towards its year-to-date low of $0.000006. A breach of this level might plunge SHIB into uncharted waters, making a new all-time low a grim possibility. Related Reading: Shiba Inu Tallies 77% Accumulation By Major Investors – Good For SHIB Price? Traders often seek additional confirmation of patterns through other technical indicators. The Relative Strength Index (RSI) is one such tool. SHIB’s weekly RSI currently stands at a neutral 39.8 (neutral). However, a recent dip below the 30-mark (indicating oversold conditions) suggests that the recent price drop might have been the last for SHIB. Should the triple bottom be validated, SHIB could witness a significant rally. An immediate target to watch would be the 23.6% Fibonacci retracement level at $0.00002545, translating to a potential surge of approximately 250% from its current price. In conclusion, SHIB’s future hangs in the balance. The coming days and weeks will be crucial in determining whether it embarks on a bullish rally or succumbs to bearish pressures. Featured image from Trader 2.0, chart from TradingView.com

Bitget exec says KYC is useful to filter out illegitimate users

Bitget managing director Gracy Chen said that if users are not doing illegitimate activities like money laundering, they should be “pretty comfortable” with the KYC process.

I did crypto Google searches like beginners. Here’s what they are and are not made aware of.

we all want crypto to be adopted, and it is slowly but surely getting more and more adopted by each day. But every new adopter is a beginner, and most of them will start with a simple google search to see how they can start off in crypto. So I did some google searches similar…
Read more

Can Pepe Coin Bounce Back? Insights On Its Future Post-Critical Support Drop

Pepe Coin has been on a wild ride in early September, characterized by significant price volatility and a troubling dip in its performance.  The price action of PEPE early this month followed a bearish pennant pattern, marked by two converging trendlines. This pattern typically signals indecision in the market, as buyers and sellers wrestle for control. However, the situation took a turn for the worse as the coin broke below its support trendline, increasing the pressure on the supply side. As of the latest data from CoinGecko, the coin is trading at $0.00000067, showing a 3.9% loss in the past 24 hours and a substantial 14.4% decline over the past week. Most notably, PEPE has tumbled out of the coveted crypto top 100 list on CoinGecko. Related Reading: Filecoin Uphill Battle To $3.5 – What’s Holding It Back? PEPE Selling Pressure Intensifies On September 10, PEPE suffered a bearish breakdown as it breached the support trendline. This development, coupled with a rising supply pressure across the altcoin landscape, resulted in a sharp decline in the value of PEPE. Investors and enthusiasts began to question the coin’s future as it struggled to maintain its position. Source: Coingape Adding to the concerns surrounding PEPE, a tweet from Lookonchain on September 11 drew attention to a peculiar event. Several investors opted to sell their PEPE holdings, swapping them for PNDC (Pandacoin). Three wallets collectively sold a staggering 1.38 trillion PEPE tokens for 600 ETH, equivalent to approximately $965,000. In a surprising twist, they reinvested 600 ETH to purchase 487 billion PNDC tokens. We noticed that 3 wallets changed their $PEPE positions to $PNDC today. They sold a total of 1.38T $PEPE for 600 $ETH($965K) and spent 600 $ETH to buy 487B $PNDC. Address:https://t.co/tPT0P3KvOghttps://t.co/nKOS9H3tbGhttps://t.co/EzkRW2BuPt pic.twitter.com/f7rUHZY2jx — Lookonchain (@lookonchain) September 11, 2023 On-Chain Metrics Paint A Grim Picture A deeper look at PEPE’s on-chain metrics reinforced the growing unease within the crypto community. Buying pressure on the meme-inspired coin remained high, which, paradoxically, contributed to the bearish sentiment. Notably, PEPE’s supply on exchanges experienced a sharp increase over the past few days, indicating a surge in selling activity.  PEPEUSD currently trading at $0.000001 on the daily chart: TradingView.com What Lies Ahead For Pepe Coin? This shift occurred simultaneously with a decrease in PEPE’s supply outside of exchanges, further highlighting the rising selling pressure. Moreover, PEPE’s exchange inflow witnessed a noticeable spike, while the total number of holders declined, painting a gloomy picture for the cryptocurrency. Related Reading: Massive PEPE Token Dump: Whale Unloads 762 Billion At Loss As Price Wobbles PEPE’s early September performance has been nothing short of turbulent. Its journey from a bearish pennant pattern to a breakdown below support has left investors and enthusiasts concerned about its future. The notable wallet activity and on-chain metrics only serve to compound these concerns, leaving the crypto community with more questions than answers about the fate of PEPE in the coming days. (This site’s content should not be construed as investment advice. Investing involves risk. When you invest, your capital is subject to risk). Featured image from Tallahassee Democrat

Will DOT go down further after the unlock from Parachain Auctions next month?

Two years ago millions of DOT tokens were locked as part of the Polkadot Parachain Slot Auction. A total number of 113.5 Million DOT was bonded to crowdloans and 99.2 Million DOT was locked in slots for 96 weeks (until October 20th, 2023). This 99.2million will be returned to the users who loaned it and…
Read more

Binance.US calls SEC’s court requests ‘unreasonable’ in new filing

Binance said the SEC’s requests are “unduly burdensome” soon after the parties agreed on a joint motion to file confidential information under seal.

CNA Insurance excludes NFTs from coverage of $20M trust policy

The insurer attached an exclusion saying that any losses, damage, claim, occurrence or lawsuit related to NFTs are not covered by the policy.

SIM swapping: How works and how to protect yourself

A 'hacker' calls the victim's telecom provider and convinces the employee to transfer the victim's mobile number to a blank SIM card the hacker has in possession. They use excuses like the old SIM card being damaged, lost, or the entire phone was stolen. The phone number will be activated on the blank SIM and…
Read more

Bitcoin Price Bounces Back To $26,000, Here’s Why

In a swift turnaround from yesterday’s dip, Bitcoin (BTC) surged to nearly $26,000 during Asian trading hours on Tuesday. This recovery, which saw the BTC  climb from $25,210 to $25,973 in a mere 30 minutes (from 3:00 am to 3:30 am UTC), was not driven by any specific news event. Instead, the dynamics within the Bitcoin futures market played a pivotal role. Why Has The Bitcoin Price Bounced Upwards? Renowned analyst Skew provided a technical perspective on the price movement, referring to it as a “textbook short squeeze.” Delving deeper into Skew’s analysis, he pointed out a clear divergence in the Cumulative Volume Delta (CVD) of perpetual contracts (or “perps”) with the actual price. In trading, a divergence between CVD and price can signal a potential reversal. In this context, while sellers were trying to push the price below $25,000, the CVD indicated that buying pressure was mounting. Related Reading: Bitcoin Weekly TD Sequential Buy Setup Appears, But Warns Of Potential Risk Furthermore, the futures market had a high number of short positions relative to the open interest (OI), and the funding rate was negative. A negative funding rate typically means that shorts are paying longs, indicating a bearish sentiment. Despite attempts to drive the price down, Bitcoin was reclaiming its swing long price level at $25,300 and failed to maintain the bearish trend in the lower time frame (LTF). The spot market, where assets are bought and sold for immediate delivery, was showing signs of a bullish structure change, with prices gradually moving higher. Skew suggested that the culmination of these factors led to a short squeeze, where those who bet against the market (short sellers) are forced to buy back into the market to cover their positions, further driving up the price. Skew’s analysis essentially highlights that while there was a bearish sentiment with many traders betting against Bitcoin, underlying indicators were hinting at a potential bullish reversal. For traders, the immediate goal post-squeeze is to reclaim $26,000. TheKingfisher offered a more succinct take, hinting at the short squeeze and its impact on those who were betting against Bitcoin: “See you around high lev shorters. BTC Cleared them again.” Related Reading: Bitcoin Price Confirms Double Top, How Low Can BTC Drop? Axel Adler Jr. shed light on the broader market sentiment, noting, “Traders do not plan to go any lower. Net Taker Volume has risen by 9.79%. Over the past year, this is a new record for the balance of open Taker orders with long positions.” Despite the rapid price movement, the short squeeze’s magnitude was relatively modest. Coinglass data reveals that about $12.32 million in BTC shorts were liquidated. For context, the most significant short liquidation event in the last three months occurred on August 17, amounting to $120 million, when BTC briefly dipped to $24,700 before making a quick recovery above $26,600. The decline in open interest in futures on the major exchanges was also rather small. According to Coinglass, open interest fell from $10.66 billion to $10.65 billion. This slight decline suggests that few traders had to close their bets, with funding rates turning positive, signaling a shift from bearish to bullish sentiment. At press time, BTC stood at $25,768. Featured image from Millionero Magazine, chart from TradingView.com

CFTC Commissioner plans to modernize investor protection with technology

To minimize the damages caused by financial fraud, Romero proposed the formation of the National Financial Fraud Registry — a centralized record of all crimes and fines related to financial fraud.