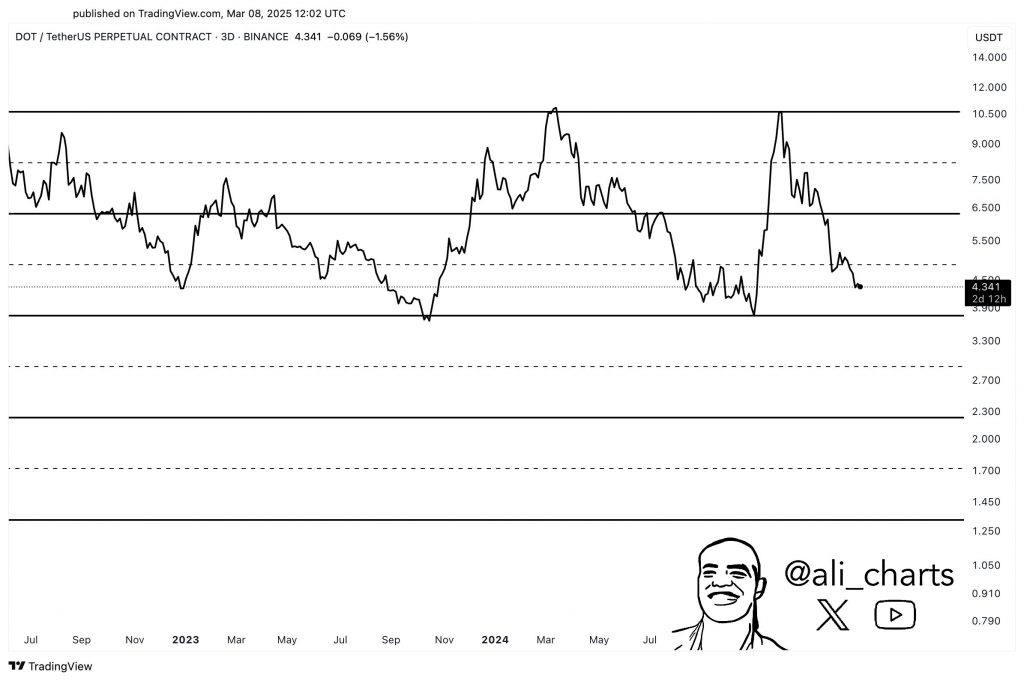
Category: Cryptocurrency News

Cryptocurrency News and Public Mining Pools

Telegram Gets a Crypto Wallet—3 Years After SEC Pumped the Brakes – Decrypt

submitted by /u/ASTrAY_1 [link] [comments]

Halving Heralds a Bitcoin Boom: Top Industry Insiders Predict a $100k Milestone by 2024

submitted by /u/jorneyp [link] [comments]

Beyond XRP Euphoria And $0.5 Resistance: Bulls’ Next Steps

XRP, the cryptocurrency associated with the Ripple platform, has experienced a tumultuous ride in recent weeks. The price action of XRP showed that the bears were firmly in control, extinguishing the brief euphoria that followed Ripple’s legal triumph over the United States Securities and Exchange Commission.  At the pinnacle of Ripple’s legal victory, XRP surged above the $0.80 mark, a level unseen since April 2022. However, this jubilation was short-lived. The excitement fizzled out as XRP’s value nosedived, erasing its gains and plunging it back into bearish territory. The abrupt reversal raised questions about the sustainability of the crypto’s upward trajectory. Investors, once filled with hope, are now left wondering about the future of this once-promising token. Related Reading: Chainlink (LINK) Bullish Run Falters: Time To Brace For A Price Dip? XRP Market Insights Paint A Grim Picture Popular crypto trader Benjamin Cowen pointed out on X that “XRP has retraced the entirety of the move that came after the SEC vs. Ripple case.” This statement underscores the market’s sentiment, suggesting that the legal triumph’s positive impact on XRP’s price was only temporary. $XRP has retraced the entirety of the move that came after the SEC vs. Ripple case. Narratives do not drive the market, liquidity does. pic.twitter.com/8295jFRdHB — Benjamin Cowen (@intocryptoverse) September 11, 2023 As of now, XRP’s price hovers at $0.480443, according to CoinGecko, with a modest 2.0% gain over the past 24 hours. However, a more concerning statistic is the seven-day dip, which stands at nearly 5%. This decline reflects the current bearish sentiment surrounding the digital asset. Since early August, the 1-day chart for XRP has displayed a bearish market trend and a downward movement. Since bulls failed to break through last week’s $0.5 resistance, a revisit of that level could be a good opportunity for short sellers. Selling Pressure Evident  A closer look at XRP’s on-chain metrics reveals that the selling pressure has been palpable. The On-Balance Volume (OBV), an indicator that tracks buying and selling volumes, has been in a downtrend alongside the price over the past month.  XRP market cap currently at $25 billion. Chart: TradingView.com This suggests that sellers have been dominant in the market, while buyers have struggled to exert influence, especially in higher timeframes. This scenario further confirms the bearish grip on XRP. Another metric worth noting is the mean coin age, which measures the average age of coins being transacted on the network. The metric experienced a sharp decline on August 30 and September 1 but has since started to climb higher. Related Reading: Filecoin Uphill Battle To $3.5 – What’s Holding It Back? While this may indicate network-wide accumulation, it does not guarantee an immediate uptrend. Investors must remain cautious and observant in the face of uncertain market conditions. The recent price action of XRP has cast a shadow on the crypto’s prospects. Despite the initial excitement surrounding Ripple’s legal victory, the bears have reclaimed control, driving XRP’s value downward. With key metrics reflecting selling pressure and uncertainty in the market, XRP’s future remains uncertain, leaving investors to ponder their next moves in this volatile landscape. (This site’s content should not be construed as investment advice. Investing involves risk. When you invest, your capital is subject to risk). Featured image from The Change Management Blog

Coinbase to List VeChain ($VET) and VeThor ($VTHO)

submitted by /u/ellileon [link] [comments]

Blockchain active users can be misleading metric: Crypto data scientist

0xScope co-founder Philip Torres says it doesn’t take much effort to spin up thousands of blockchain wallet addresses and pump up user metrics.

US ‘the only country’ crypto startups should avoid, says Ripple CEO

submitted by /u/vijnsko [link] [comments]

US ‘the only country’s crypto startups should avoid, says Ripple CEO

Brad Garlinghouse says Singapore, the U.K., the UAE and Switzerland are jurisdictions with “smart” crypto policies that he thinks the U.S. should adopt.

Explaining the Defi key categories and how they work – perfect for complete beginners

Ok guys, let's break down how decentralized DeFi (Decentralized Finance) is into three levels: centralized, semi-decentralized, and completely decentralized. ​ Centralized: This is the least decentralized category. In this type, a central authority or company has a lot of control. They hold your assets (like a bank), decide interest rates, and provide liquidity. Examples include…
Read more

Tron Price Prediction: TRX Again Outperforms Bitcoin and ETH, $0.10 Possible?

Tron price is showing positive signs above $0.080 against the US Dollar. TRX is outperforming Bitcoin and could start another increase toward $0.10. Tron is moving higher above the $0.0800 pivot level against the US dollar. The price is trading above $0.080 and the 100 simple moving average (4 hours). There is a connecting bullish trend line forming with support near $0.0780 on the 4-hour chart of the TRX/USD pair (data source from Kraken). The pair could continue to climb higher toward $0.085 or even $0.095. Tron Price Surges Further In the last Tron price analysis, we discussed the chances of more gains in TRX against the US Dollar. TRX formed a base above the $0.0770 level and started another increase. There was a clear move above the $0.080 resistance zone, outperforming Bitcoin. The price even cleared the $0.082 level. A high is formed near $0.0828 and the price is now correcting gains below the 23.6% Fib retracement level of the upward move from the $0.0770 swing low to the $0.0828 high. TRX is now trading above $0.080 and the 100 simple moving average (4 hours). There is also a connecting bullish trend line forming with support near $0.0780 on the 4-hour chart of the TRX/USD pair. Source: TRXUSD on TradingView.com On the upside, an initial resistance is near the $0.0815 level. The first major resistance is near $0.0828, above which the price could accelerate higher. The next resistance is near $0.085. A close above the $0.085 resistance might send TRX further higher. The next major resistance is near the $0.092 level, above which the bulls are likely to aim a larger increase toward the key $0.10 zone in the coming days. Are Dips Supported in TRX? If TRX price fails to clear the $0.0815 resistance, it could slowly move lower. Initial support on the downside is near the $0.080 zone. The first major support is near the $0.0792 level or the 61.8% Fib retracement level of the upward move from the $0.0770 swing low to the $0.0828 high. The next support is near $0.0780 or the trend line, below which the price could accelerate lower. The next major support is $0.0755. Technical Indicators 4 hours MACD – The MACD for TRX/USD is losing momentum in the bullish zone. 4 hours RSI (Relative Strength Index) – The RSI for TRX/USD is currently above the 50 level. Major Support Levels – $0.080, $0.0792, and $0.0780. Major Resistance Levels – $0.0815, $0.0828, and $0.092.

Ethereum Price Faces Uphill Task and Could Restart Decline To $1,500

Ethereum price is attempting a recovery wave above $1,580 against the US Dollar. ETH is struggling to clear $1,620 and might start another decline. Ethereum is struggling to gain pace for a move above $1,600 and $1,620. The price is trading below $1,600 and the 100-hourly Simple Moving Average. There is a major bearish trend line forming with resistance near $1,600 on the hourly chart of ETH/USD (data feed via Kraken). The pair could start another decline unless there is a close above $1,620. Ethereum Price Struggles Above $1,600 Ethereum’s price started an upside correction from the $1,530 level. ETH managed to recover above the $1,560 and $1,580 resistance levels, like Bitcoin. The bulls even pushed the price above the 50% Fib retracement level of the key decline from the $1,670 swing high to the $1,530 low. The price climbed above the $1,600 resistance level and the 100-hourly Simple Moving Average. However, the bears took a stand near the key resistance at $1,620. Ether failed to clear the 61.8% Fib retracement level of the key decline from the $1,670 swing high to the $1,530 low. There is also a major bearish trend line forming with resistance near $1,600 on the hourly chart of ETH/USD. Ethereum is now trading below $1,600 and the 100-hourly Simple Moving Average. On the upside, the price might face resistance near the $1,595 level or the trend line. The next resistance is near the $1,620 level. A close above the $1,620 resistance might send the price toward the $1,670 resistance. Source: ETHUSD on TradingView.com The next major hurdle is near the $1,720 level. A close above the $1,720 level might send Ethereum further higher toward $1,800. Another Drop in ETH? If Ethereum fails to clear the $1,600 resistance, it could start another decline. Initial support on the downside is near the $1,565 level. The first key support is close to $1,550. The next key support is $1,530. A downside break below $1,530 might push the price further lower toward the $1,500 zone. In the stated case, the price could even decline toward the $1,440 level in the near term. Technical Indicators Hourly MACD – The MACD for ETH/USD is slowly gaining momentum in the bearish zone. Hourly RSI – The RSI for ETH/USD is now below the 50 level. Major Support Level – $1,550 Major Resistance Level – $1,620