Sam Bankman-Fried posts for the first time in 2 years, FTX Token pumps
Former FTX CEO Sam Bankman-Fried said he had not checked his email for the past few hundred days and that being employed is a lot less relaxing than it looks.
Former FTX CEO Sam Bankman-Fried said he had not checked his email for the past few hundred days and that being employed is a lot less relaxing than it looks.
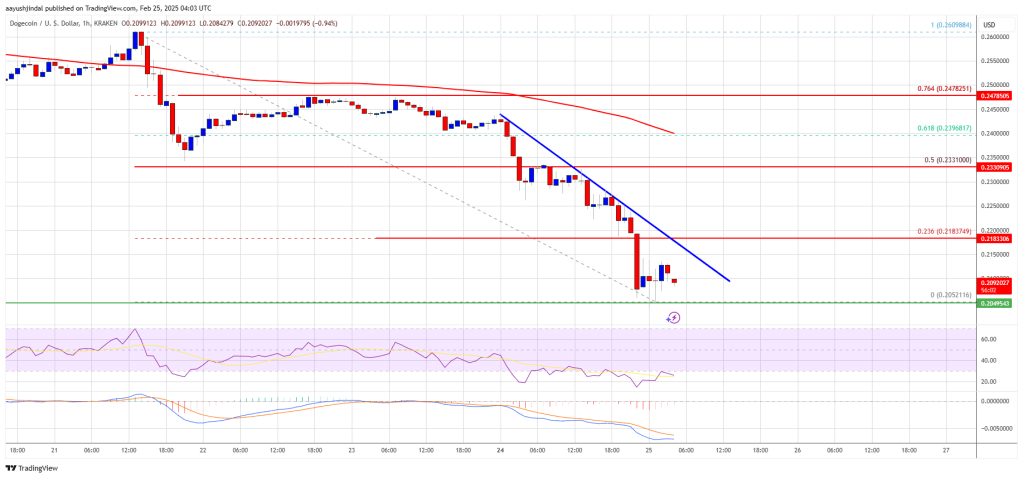
Dogecoin started a fresh decline below the $0.250 zone against the US Dollar. DOGE tested $0.2050 is now consolidating below the $0.2250 resistance. DOGE price started a fresh decline below the $0.260 and $0.250 levels. The price is trading below the $0.2380 level and the 100-hourly simple moving average. There is a connecting bearish trend line forming with resistance at $0.2180 on the hourly chart of the DOGE/USD pair (data source from Kraken). The price could start a recovery if it clears the $0.2180 and $0.2200 resistance levels. Dogecoin Price Dips Over 5% Dogecoin price started a fresh decline below the $0.2650 zone, unlike Bitcoin and Ethereum. DOGE dipped below the $0.260 and $0.250 support levels. It even spiked below $0.2150. A low was formed at $0.2052 and the price is now consolidating losses. There was a move above the $0.2080 level, but the price remained below the 23.6% Fib retracement level of the downward move from the $0.2609 swing high to the $0.2052 low. Dogecoin price is now trading below the $0.2250 level and the 100-hourly simple moving average. Immediate resistance on the upside is near the $0.2150 level. The first major resistance for the bulls could be near the $0.2180 level. There is also a connecting bearish trend line forming with resistance at $0.2180 on the hourly chart of the DOGE/USD pair. The next major resistance is near the $0.2250 level. A close above the $0.2250 resistance might send the price toward the $0.2330 resistance and the 50% Fib retracement level of the downward move from the $0.2609 swing high to the $0.2052 low. Any more gains might send the price toward the $0.250 level. The next major stop for the bulls might be $0.2620. More Losses In DOGE? If DOGE’s price fails to climb above the $0.2180 level, it could start another decline. Initial support on the downside is near the $0.2065 level. The next major support is near the $0.2050 level. The main support sits at $0.20. If there is a downside break below the $0.20 support, the price could decline further. In the stated case, the price might decline toward the $0.1880 level or even $0.1740 in the near term. Technical Indicators Hourly MACD – The MACD for DOGE/USD is now gaining momentum in the bearish zone. Hourly RSI (Relative Strength Index) – The RSI for DOGE/USD is now below the 50 level. Major Support Levels – $0.2050 and $0.2000. Major Resistance Levels – $0.2180 and $0.2250.
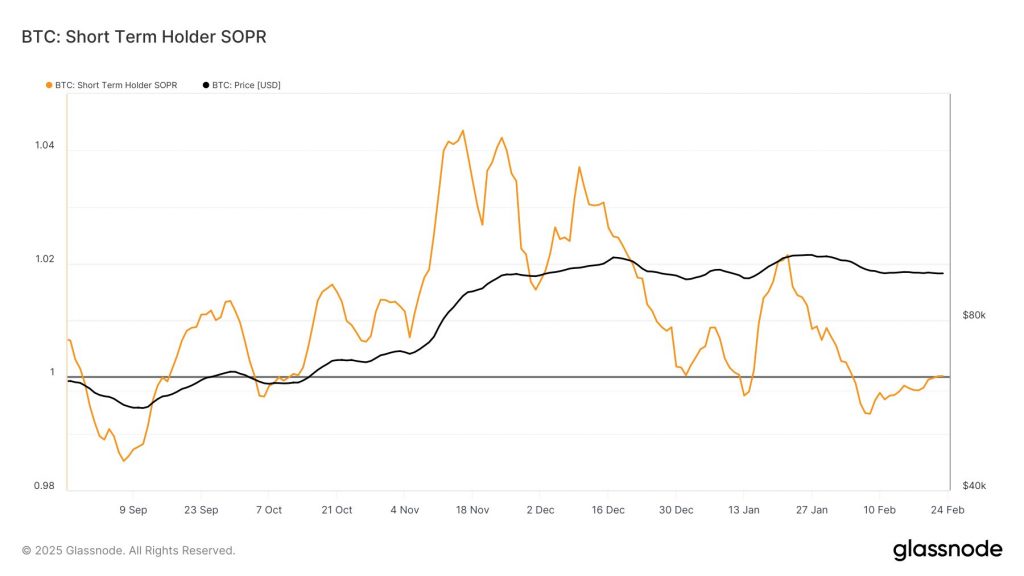
On-chain data shows a Bitcoin indicator is currently retesting a level that has historically acted as a boundary line between bearish and bullish momentum. Bitcoin Short-Term Holder SOPR Is Retesting 1.0 Right Now In a new post on X, the on-chain analytics firm Glassnode has discussed about the latest trend in the BTC Spent Output Profit Ratio (SOPR) of the short-term holders. Related Reading: $200 Million In Crypto Longs Wiped Out As Altcoins Crash To Start Week The “SOPR” here refers to an on-chain indicator that tells us about whether the Bitcoin investors as a whole are selling or transferring their coins at a profit or loss. When the value of this metric is greater than 1, it means the average holder of the asset is selling at a net profit. On the other hand, it being under this threshold suggests the overall market is realizing a net loss. Naturally, the SOPR being exactly equal to the 1 level implies the profits being realized by the investors are canceling out the losses, so the average holder can be assumed to be just breaking-even on their transactions. In the context of the current topic, the SOPR of only a specific investor group is of interest: the short-term holders (STHs). The STHs include the Bitcoin investors who purchased their tokens within the past 155 days. Now, here is the chart shared by the analytics firm that shows the trend in the 7-day moving average (MA) of the Bitcoin STH SOPR over the last few months: As is visible in the above graph, the Bitcoin STH SOPR fell under the 1 mark earlier in the year, implying the STHs took to loss-taking as the price of the cryptocurrency moved in a bearish trajectory. Recently, though, the metric has been making recovery and it’s now back at the break-even level. “Historically, breaking above 1.0 confirms a shift in momentum, while failure to do so often leads to renewed sell pressure,” explains Glassnode. Breaking above the level, however, is no simple task, for it serves as a major psychological level for the STHs. These investors are by definition the entities who are either new to the market or just not resolute enough to hold for long periods, so they can be prone to panic selloffs. When the STH SOPR rises to the 1 mark, it means these investors, who were forced into loss selling earlier, are able to break-even again. Selling pressure can spike when this happens, as STHs rush to get their money ‘back.’ Related Reading: Is It Time To Buy XRP? TD Sequential Says Yes The last time that Bitcoin saw the indicator make a retest of this level was back in January. From the chart, it’s apparent that it successfully found a breakout then, although it was only short-lived. It now remains to be seen whether the metric can surge into the profit zone this time as well or not. BTC Price Bitcoin has been slipping down during the past few days as its price has come down to the $94,500 level. Featured image from Dall-E, Glassnode.com, chart from TradingView.com

The launch of the $1 billion bitcoin treasury by Rezolve Ai starting with an initial $100 million investment, aims to support its AI-powered crypto payment platform in collaboration with Tether. The initiative aims to accelerate the mainstream adoption of bitcoin and digital payments in retail commerce. Rezolve Ai Bets Big on Bitcoin With Billion Dollar […]

submitted by /u/Odd-Radio-8500 [link] [comments]

submitted by /u/abcoathup [link] [comments]

Key Takeaways: The Canary HBAR ETF could give investors another way to access Hedera’s HBAR token as Nasdaq has filed to list the ETF with the SEC. The submission is an indication of a rising pattern in the number of altcoin ETF proposals, possibly marking the beginning of a new era in the crypto investment scene. The…
Read more
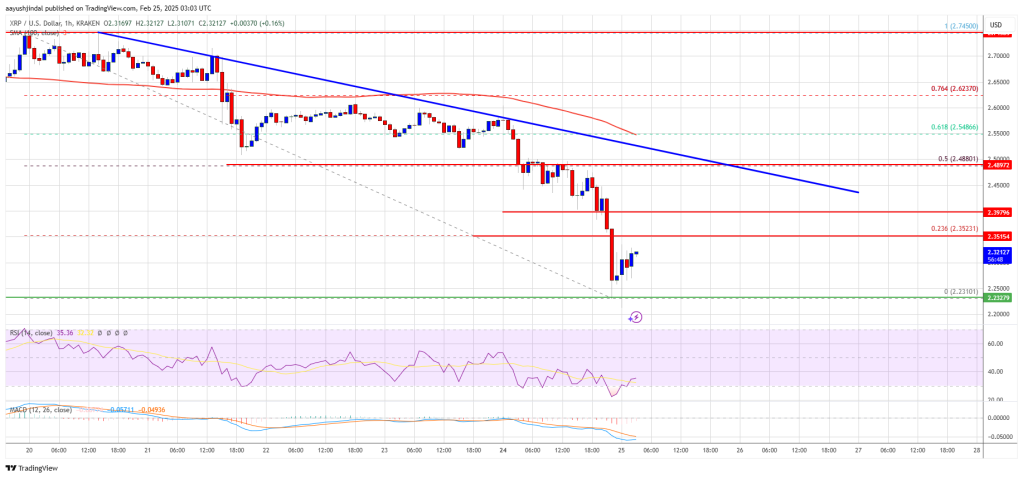
XRP price started a fresh decline below the $2.550 and $2.50 support levels. The price is now testing $2.250 and might continue to move down. XRP price started a fresh decline below the $2.50 level. The price is now trading below $2.50 and the 100-hourly Simple Moving Average. There is a key bearish trend line forming with resistance at $2.4880 on the hourly chart of the XRP/USD pair (data source from Kraken). The pair might continue to move down unless there is a close above the $2.50 resistance zone. XRP Price Dips Below Support XRP price failed to continue higher above the $2.75 resistance zone and started a fresh decline, like Bitcoin and Ethereum. There was a move below the $2.65 and $2.55 support levels. The price even dipped below the $2.50 support to enter a bearish zone. A low was formed at $2.2310 and the price is now attempting to recover toward the 23.6% Fib retracement level of the downward wave from the $2.7450 swing high to the $2.2310 low. The price is now trading below $2.50 and the 100-hourly Simple Moving Average. On the upside, the price might face resistance near the $2.3250 level. The first major resistance is near the $2.40 level. The next resistance is $2.4880 or the 50% Fib retracement level of the downward wave from the $2.7450 swing high to the $2.2310 low. There is also a key bearish trend line forming with resistance at $2.4880 on the hourly chart of the XRP/USD pair. A clear move above the $2.4880 resistance might send the price toward the $2.550 resistance. Any more gains might send the price toward the $2.620 resistance or even $2.650 in the near term. The next major hurdle for the bulls might be $2.750. More Losses? If XRP fails to clear the $2.3250 resistance zone, it could start another decline. Initial support on the downside is near the $2.250 level. The next major support is near the $2.220 level. If there is a downside break and a close below the $2.220 level, the price might continue to decline toward the $2.120 support. The next major support sits near the $2.050 zone. Technical Indicators Hourly MACD – The MACD for XRP/USD is now gaining pace in the bearish zone. Hourly RSI (Relative Strength Index) – The RSI for XRP/USD is now below the 50 level. Major Support Levels – $2.220 and $2.120. Major Resistance Levels – $2.40 and $2.4880.

submitted by /u/ligi [link] [comments]
The legislation also requires state pension funds to evaluate investing in crypto exchange-traded funds, and covers the right to self-custody and crypto mining.