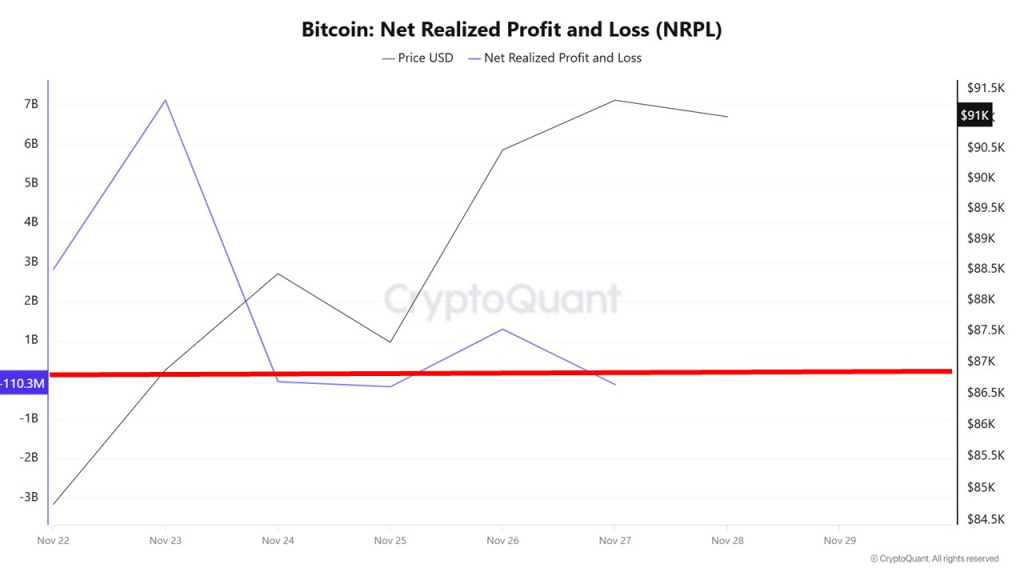
Category: Cryptocurrency News

Cryptocurrency News and Public Mining Pools

Ethereum, Dogecoin, And The Altcoin Market: Why Up-Only For 217 Days Is Possible

A new technical analysis suggests that the crypto market, which includes altcoins like Ethereum (ETH) and Dogecoin (DOGE), is about to experience a major altcoin season that could last 217 days. If critical support levels are maintained, the analyst suggests that we may finally see the long-anticipated altcoin season.  Ethereum And Dogecoin To See An Altcoin Season Soon Sporia, a TradingView crypto analyst, has shared a detailed technical analysis of the altcoin market. The analysis highlights key indicators within the Total2 chart, which represents the total crypto market cap excluding Bitcoin. The market expert emphasizes the importance of holding a critical support level, noting that the highly anticipated altcoin season could finally begin if this zone is maintained.  Related Reading: Crypto Pundit Says Ethereum Price Is ‘Destined’ To Reach $10,000 This Cycle, Here’s Why Notably, top cryptocurrencies like Ethereum and Dogecoin could benefit from this market shift into an altcoin season. The analyst also noted that current market conditions coincide with Fibonacci time sequences, which may signal an inflection point for altcoin prices. Sporia shared a price chart, describing it as his secret weapon in determining bottom signals for altcoins. Since 2022, the chart has indicated a significant bottom each time the market encountered resistance at a crucial point. As of this week, the chart has recorded a bottom, marking the fourth hit around the critical resistance zone.  The analyst has expressed excitement about this trend, solidifying his confidence in a strong altcoin season. He further underscores that the alignment of events, including key support line formations during the week of the Fibonacci time sequences, indicates the heightened possibility of a major market shift.  While tracking Fibonacci-based time cycles, Sporia revealed that the first two hits did not trigger any major events, but the third hit at the 2.618 level led to a significant pivot. Currently, this fourth hit at the 3.618 level coincides with the August 2024 altcoin crash, which mirrored the COVID crash in the last cycle. This suggests a 50% accuracy rate for the current Fibonacci sequence, making it an ideal target to watch for a potential bottom and pivot.  Altcoin Market Bull Rally To Last Only 217 Days  Diving further into his analysis, Sporia predicts that the altcoin market could rally for 217 days, peaking by October 13, 2025, roughly 20 to 30 days after Bitcoin reaches its projected cycle top. He argues that, historically, Bitcoin has always hit a cycle top before altcoins.  Related Reading: Altcoins Season: Recent Crypto Dip Shows Decline May Be Over And Bulls Are Taking Charge In 2021, Bitcoin peaked in April, and the altcoin market topped 28 days later. Similarly, in 2017, Bitcoin reached the top of the market, and altcoins followed 22 days later. For this market cycle, Sporia projects that Bitcoin will hit its highest point by mid-September after a typical 1,050-day cycle from its previous market bottom.  Notably, the analyst revealed that the last time the altcoin market hit the 3.618 Fib level, its total market capitalization surged to $5 trillion. Overall, Sporia has indicated a 99% surety that the altcoin market will bottom so long as the key diagonal support holds. If it does, he highlights that the market should expect a V-shaped recovery and an uptrend lasting for 217 days. Featured image from Unsplash, chart from Tradingview.com

‘Very possible’ Bitcoin consolidates for 8 months again: 10x Research

10x Research’s head crypto researcher isn’t ruling out Bitcoin repeating its 2024 price action, where it spent the majority of the year consolidating after hitting all-time highs early on.“Very possible,” Markus Thielen told Cointelegraph when asked what the chances of Bitcoin (BTC) repeating a similar market movement to 2024. In March 2024, Bitcoin reached an all-time high of $73,679 before entering a consolidation phase, swinging within a range of around $20,000 up until Donald Trump was elected as US president in November.Bitcoin’s current chart signals “market indecision”Thielen said he had this thought even two months ago, around the time Bitcoin hit its current all-time high of $109,000 on the day of Trump’s inauguration.He explained in his most recent market report on March 15 that Bitcoin’s current chart resembles a “High and Tight Flag,” which, despite typically being a bullish continuation pattern, shows signs of weakness.Bitcoin’s price chart is forming a High, Tight Flag Pattern. Source: 10x Research“Two flags instead of a single, precise formation weakens this setup,” Thielen said.“As a result, the pattern currently suggests market indecision rather than a straightforward bullish consolidation,” he added.Meanwhile, he also pointed out that the spot Bitcoin exchange-traded fund (ETF) market shows no signs of a “buy-the-dip” mentality.“Little incentive” to take advantage of Bitcoin’s recent price dip“This aligns with our view that most ETF flows came from arbitrage-driven hedge funds. Given the persistently low funding rates, there’s little incentive or willingness to deploy additional capital despite the recent price correction,” Thielen said. Since the beginning of March, when Bitcoin fell below $90,000, spot Bitcoin ETFs in the US have recorded total outflows of around $1.66 billion, according to Farside data.Bitcoin is trading at $84,290 at the time of publication, according to CoinMarketCap. This represents a 23% decline from its $109,000 January all-time high.Bitcoin is down 12.86% over the past month. Source: CoinMarketCapThielen is unsure if Bitcoin’s uptrend will resume in the short term. ”Therefore, it may be prudent to close short positions at this stage, although there remains little evidence to support a strong price recovery,” Thielen said.Related: Bitcoin panic selling costs new investors $100M in 6 weeks — ResearchEver since Bitcoin fell below $80,000 on Feb. 28 — the first time since November — amid growing macroeconomic uncertainty over US President Donald Trump’s proposed tariffs, several crypto analysts have been predicting further downfall for the asset.On March 10, BitMEX co-founder and Maelstrom chief investment officer Arthur Hayes said, “It looks like Bitcoin will retest $78,000.” “If it fails, $75,000 is next in the crosshairs,” he added.Meanwhile, Iliya Kalchev, dispatch analyst at digital asset investment platform Nexo, told Cointelegraph on March 11 that the low $70,000 range could “provide a foundation for a more sustainable recovery.”Magazine: Crypto fans are obsessed with longevity and biohacking: Here’s why

'Very possible' Bitcoin consolidates for 8 months again: 10x Research

10x Research’s head crypto researcher isn’t ruling out Bitcoin repeating its 2024 price action, where it spent much of the year consolidating after hitting all-time highs early on.“Very possible,” Markus Thielen told Cointelegraph when asked what the chances of Bitcoin (BTC) repeating a similar market movement to 2024, where it reached an all-time high of $73,679 in March before entering a consolidation phase, swinging within a range of around $20,000 up until Donald Trump was elected as US president in November.Bitcoin’s current chart signals “market indecision”Thielen said he had this thought even two months ago, around the time Bitcoin hit its current all-time high of $109,000 on the day of Trump’s inauguration.He explained in his most recent market report on March 15 that Bitcoin’s current chart resembles a “High and Tight Flag,” which, despite typically being a bullish continuation pattern, shows signs of weakness.Bitcoin’s price chart is forming a High, Tight Flag Pattern. Source: 10x Research“Two flags instead of a single, precise formation weakens this setup,” Thielen said.“As a result, the pattern currently suggests market indecision rather than a straightforward bullish consolidation,” he added.Meanwhile, he also pointed out that the spot Bitcoin exchange-traded fund (ETF) market shows no signs of a “buy-the-dip” mentality.“Little incentive” to take advantage of Bitcoin’s recent price dip“This aligns with our view that most ETF flows came from arbitrage-driven hedge funds. Given the persistently low funding rates, there’s little incentive or willingness to deploy additional capital despite the recent price correction,” Thielen said. Since the beginning of March, when Bitcoin fell below $90,000, spot Bitcoin ETFs in the US have recorded total outflows of around $1.66 billion, according to Farside data.Bitcoin is trading at $84,290 at the time of publication, according to CoinMarketCap. This represents a 23% decline from its $109,000 January all-time high.Bitcoin is down 12.86% over the past month. Source: CoinMarketCapThielen is unsure if Bitcoin’s uptrend will resume in the short term. ”Therefore, it may be prudent to close short positions at this stage, although there remains little evidence to support a strong price recovery,” Thielen said.Related: Bitcoin panic selling costs new investors $100M in 6 weeks — ResearchEver since Bitcoin fell below $80,000 on Feb. 28 — the first time since November — amid growing macroeconomic uncertainty over US President Donald Trump’s proposed tariffs, several crypto analysts have been predicting further downfall for the asset.On March 10, BitMEX co-founder and Maelstrom chief investment officer Arthur Hayes said “it looks like Bitcoin will retest $78,000.” “If it fails, $75,000 is next in the crosshairs,” he added.Meanwhile, Iliya Kalchev, dispatch analyst at digital asset investment platform Nexo, told Cointelegraph on March 11 that the low $70,000 range could “provide a foundation for a more sustainable recovery.”Magazine: Crypto fans are obsessed with longevity and biohacking: Here’s why

‘Very possible’ Bitcoin consolidates for 8 months again: 10x Research

10x Research’s head crypto researcher isn’t ruling out Bitcoin repeating its 2024 price action, where it spent the majority of the year consolidating after hitting all-time highs early on.“Very possible,” Markus Thielen told Cointelegraph when asked what the chances of Bitcoin (BTC) repeating a similar market movement to 2024. In March 2024, Bitcoin reached an all-time high of $73,679 before entering a consolidation phase, swinging within a range of around $20,000 up until Donald Trump was elected as US president in November.Bitcoin’s current chart signals “market indecision”Thielen said he had this thought even two months ago, around the time Bitcoin hit its current all-time high of $109,000 on the day of Trump’s inauguration.He explained in his most recent market report on March 15 that Bitcoin’s current chart resembles a “High and Tight Flag,” which, despite typically being a bullish continuation pattern, shows signs of weakness.Bitcoin’s price chart is forming a High, Tight Flag Pattern. Source: 10x Research“Two flags instead of a single, precise formation weakens this setup,” Thielen said.“As a result, the pattern currently suggests market indecision rather than a straightforward bullish consolidation,” he added.Meanwhile, he also pointed out that the spot Bitcoin exchange-traded fund (ETF) market shows no signs of a “buy-the-dip” mentality.“Little incentive” to take advantage of Bitcoin’s recent price dip“This aligns with our view that most ETF flows came from arbitrage-driven hedge funds. Given the persistently low funding rates, there’s little incentive or willingness to deploy additional capital despite the recent price correction,” Thielen said. Since the beginning of March, when Bitcoin fell below $90,000, spot Bitcoin ETFs in the US have recorded total outflows of around $1.66 billion, according to Farside data.Bitcoin is trading at $84,290 at the time of publication, according to CoinMarketCap. This represents a 23% decline from its $109,000 January all-time high.Bitcoin is down 12.86% over the past month. Source: CoinMarketCapThielen is unsure if Bitcoin’s uptrend will resume in the short term. ”Therefore, it may be prudent to close short positions at this stage, although there remains little evidence to support a strong price recovery,” Thielen said.Related: Bitcoin panic selling costs new investors $100M in 6 weeks — ResearchEver since Bitcoin fell below $80,000 on Feb. 28 — the first time since November — amid growing macroeconomic uncertainty over US President Donald Trump’s proposed tariffs, several crypto analysts have been predicting further downfall for the asset.On March 10, BitMEX co-founder and Maelstrom chief investment officer Arthur Hayes said, “It looks like Bitcoin will retest $78,000.” “If it fails, $75,000 is next in the crosshairs,” he added.Meanwhile, Iliya Kalchev, dispatch analyst at digital asset investment platform Nexo, told Cointelegraph on March 11 that the low $70,000 range could “provide a foundation for a more sustainable recovery.”Magazine: Crypto fans are obsessed with longevity and biohacking: Here’s why

new to crypto, should I buy now, what should I buy? planning to HODL for 6-12 months till I need that money.

Will HODL for years if I needed if its going to go up, I have $150 in XRP and a $100 in Bitcoin, should I buy Solana? should I get other stuff? Im thinking I should stock up on XRP even more. new to crypto, should I buy now, what should I buy? planning to…
Read more

Daily General Discussion – March 15, 2025

Welcome to the Ethereum Daily General Discussion on r/ethereum https://imgur.com/3y7vezP Bookmarking this link will always bring you to the current daily: https://old.reddit.com/r/ethereum/about/sticky/?num=2 Please use this thread to discuss Ethereum topics, news, events, and even price! Price discussion posted elsewhere in the subreddit will continue to be removed. As always, be constructive. – Subreddit Rules Want…
Read more

Dogecoin Can Still Go Parabolic If This Support Holds, Analyst Says

An analyst has explained how Dogecoin could still have a chance at a parabolic run if the support level of this pattern ends up holding. Dogecoin Is Retesting The Lower Bound Of An Ascending Channel In a new post on X, analyst Ali Martinez has shared a long-term Ascending Channel that the 1-week price of Dogecoin has been trading inside over the years. The “Ascending Channel” here refers to a pattern from technical analysis (TA) that forms when an asset’s price observes consolidation towards a net upside between two parallel trendlines. The upper line of the channel is drawn by connecting successive higher highs. Similarly, the lower one joins higher lows. When the price is moving between these two lines, it’s likely to face resistance at the former level and support at the latter one. Related Reading: Bitcoin & Altcoin Volume Fades—Investor Exhaustion Setting In? In the scenario that the resistance or support line breaks, the asset can be likely to see a continuation of the trend in the direction of the break. This means that escapes above the channel can be bullish, while drops under it can be bearish. Like the Ascending Channel, there is also the Descending Channel, which occurs when the asset’s consolidation happens toward a net downside instead. But other than this fact, the latter works similarly to the former. There is also a third type of parallel channel, where the consolidation is exactly sideways. In this case, the trendlines are not only parallel to each other, but also to the time-axis. Now, here is the chart shared by Martinez that shows the Ascending Channel that the weekly price of Dogecoin has seemingly been stuck inside for the past decade: As is visible in the above graph, the 1-week price of Dogecoin has recently observed a sharp decline toward the bottom line of the Ascending Channel. Last year, the memecoin also made a retest of the line, which proved successful and helped its price find a rebound to the upside. Related Reading: Bitcoin Investors Shift To Strong Distribution As Demand Fades, Glassnode Reveals It’s possible that the line may once again end up holding for DOGE, but it’s still too early to say anything, considering that the last retest saw the coin move along the line for a while before bullish momentum returned. The latest retest of the line has come following a crash that has shaken assets across the cryptocurrency space and instilled fear in the minds of the investors. As long as DOGE stays inside the Ascending Channel, though, not all hope may be lost for the memecoin’s holders. As the analyst says, “Dogecoin $DOGE still has a chance to go parabolic if the $0.16 support level holds!” DOGE Price Dogecoin has been one of the worst-hit top coins in the sector during the past week, as its price has plummeted almost 17%, coming down to the $0.17 level. Featured image from Dall-E, charts from TradingView.com