Category: Cryptocurrency News

Cryptocurrency News and Public Mining Pools

Veteran Trader Peter Brandt Suggests BTC May Have Topped, Predicts a Decline to Mid-$30K

According to veteran pro trader Peter Brandt, bitcoin may have peaked when it achieved a new all-time high of $73,835. However, there is a possibility that it could now decline to the mid-$30s or even lower, Brandt said. Interestingly, Brandt suggests that such a decline could be the “most bullish thing” from a long-term perspective. […]

How to Invest in Crypto in 2024 | Beginner’s Cryptocurrency Guide

submitted by /u/afisaaaaa [link] [comments]

Ethereum Price Reverse Gains, Can ETH Bulls Save The Day?

Ethereum price rallied above the $3,300 level. ETH tested the $3,350 resistance and recently started a sharp decline below $3,300. Ethereum rallied toward $3,350 before the bears appeared again. The price is trading below $3,220 and the 100-hourly Simple Moving Average. There was a break below a key bullish trend line with support at $3,250 on the hourly chart of ETH/USD (data feed via Kraken). The pair could continue to move down if it trades below the $3,165 support. Ethereum Price Trims Gains Ethereum price started a strong increase above the $3,200 level. ETH outperformed Bitcoin and even cleared the $3,300 resistance. However, the bears were active near the $3,350 level. A high was formed at $3,355 and the price started a fresh decline. There was a sharp move below the $3,300 level. The price declined below the 50% Fib retracement level of the upward move from the $3,070 swing low to the $3,355 high. There was also a break below a key bullish trend line with support at $3,250 on the hourly chart of ETH/USD. Ethereum is now trading below $3,220 and the 100-hourly Simple Moving Average. However, the bulls are active near the $3,165 support and the 61.8% Fib retracement level of the upward move from the $3,070 swing low to the $3,355 high. Immediate resistance is near the $3,210 level and the 100-hourly Simple Moving Average. Source: ETHUSD on TradingView.com The first major resistance is near the $3,250 level. The next key resistance sits at $3,350, above which the price might gain traction and rise toward the $3,465 level. A close above the $3,465 resistance could send the price toward the $3,550 resistance. If there is a move above the $3,550 resistance, Ethereum could even test the $3,680 resistance. Any more gains could send Ether toward the $3,750 resistance zone. More Downsides In ETH? If Ethereum fails to clear the $3,210 resistance, it could continue to move down. Initial support on the downside is near the $3,180 level. The first major support is near the $3,165 zone. The main support is near the $3,070 level. A clear move below the $3,070 support might set the pace for more losses and send the price toward $3,030. Any more losses might send the price toward the $2,880 level in the near term. Technical Indicators Hourly MACD – The MACD for ETH/USD is gaining momentum in the bearish zone. Hourly RSI – The RSI for ETH/USD is now below the 50 level. Major Support Level – $3,165 Major Resistance Level – $3,210

Solo Bitcoin miner wins the 3.125 BTC lottery, solving valid block

The solo miner netted around $200,000 in rewards for validating block 841,286.

Hut 8 ‘self-mining plans’ make it competitive post-halving: Benchmark

submitted by /u/A-Dog22 [link] [comments]

Does Money Transmitting Require Control? DOJ Says No in Tornado Cash Litigation

Since the Department of Justice (DOJ) filed its legal opposition to the pretrial motions of Tornado Cash developers Roman Storm and Roman Semenov, there has been a buzz within the cryptocurrency community regarding specific aspects of the court filing. A key point raised by the prosecutors is their belief that the definition of “money transmitting” […]

Bitcoin Price Grinds Lower As Bears Aim For New Monthly Low

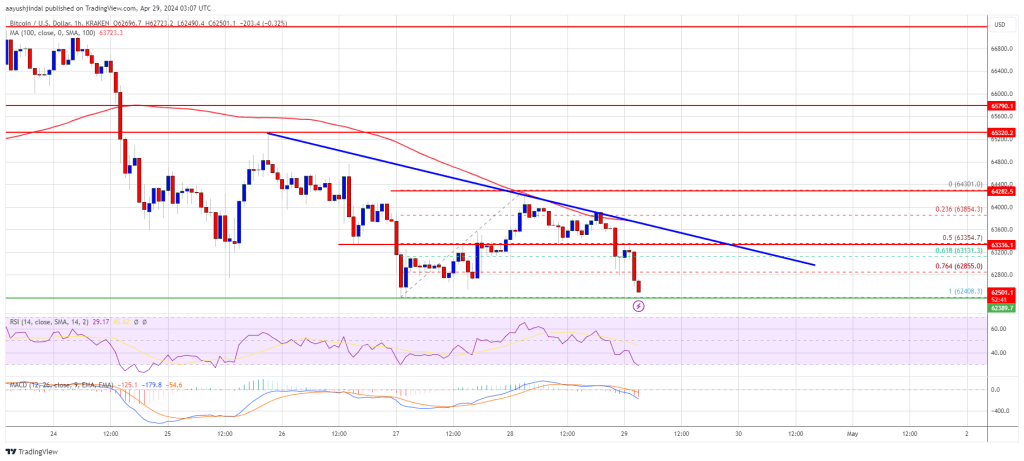
Bitcoin price struggled to settle above the $65,000 zone. BTC is again moving lower and there is a risk of more downsides below $62,000. Bitcoin started another decline after it failed to surpass the $64,000 resistance zone. The price is trading below $64,500 and the 100 hourly Simple moving average. There is a key bearish trend line forming with resistance at $63,350 on the hourly chart of the BTC/USD pair (data feed from Kraken). The pair could accelerate lower if there is a daily close below the $62,400 support zone. Bitcoin Price Dives Again Bitcoin price attempted a fresh increase above the $64,000 zone. However, BTC failed to gain pace for a move above the $65,000 resistance zone. A high was formed at $64,301 and the price started another decline. There was a move below the $63,800 level. The price declined below the 50% Fib retracement level of the upward move from the $62,408 swing low to the $64,301 high. Bitcoin is now trading below $63,200 and the 100 hourly Simple moving average. There is also a key bearish trend line forming with resistance at $63,350 on the hourly chart of the BTC/USD pair. The pair is signalling a bearish bias below the 76.4% Fib retracement level of the upward move from the $62,408 swing low to the $64,301 high. Immediate resistance is near the $63,350 level or the trend line. The first major resistance could be $64,000 or $64,300. A clear move above the $64,300 resistance might send the price higher. The next resistance now sits at $65,000. Source: BTCUSD on TradingView.com If there is a clear move above the $65,000 resistance zone, the price could continue to move up. In the stated case, the price could rise toward $65,500. The next major resistance is near the $66,200 zone. Any more gains might send Bitcoin toward the $67,500 resistance zone in the near term. More Losses In BTC? If Bitcoin fails to rise above the $63,350 resistance zone, it could continue to move down. Immediate support on the downside is near the $62,400 level. The first major support is $62,000. If there is a close below $62,000, the price could start to drop toward $61,200. Any more losses might send the price toward the $60,000 support zone in the near term. Technical indicators: Hourly MACD – The MACD is now gaining pace in the bearish zone. Hourly RSI (Relative Strength Index) – The RSI for BTC/USD is now below the 50 level. Major Support Levels – $62,400, followed by $62,000. Major Resistance Levels – $63,350, $64,000, and $65,000.

DOJ’s Tornado Cash arguments show ‘obvious disdain for privacy’ — Lawyer

DeFi Education Fund’s legal chief said the prosecutors’ arguments against Roman Storm’s motion to dismiss were “filled with technical inaccuracies.”

Noose

Eth has already tied the noose it will use to hang itself. It started day 1. Eth was doomed from the get go. But it still is a cash cow.. milk that cow until it naturally dies of dehydration submitted by /u/KegtronMcAwesome [link] [comments]

South African BTC Ponzi Scheme Mastermind Succumbs to Heart Attack While Detained in Brazil

Johann Steynberg, the mastermind behind a South African bitcoin Ponzi scheme, recently died of a heart attack while under house arrest on a farm in Brazil. According to his Brazilian wife, Steynberg left no will and had no assets that could be inventoried. South African Police Investigate Steynberg’s Reported Death Johann Steynberg, a South African […]