Crypto Market’s Fate Hangs On The Last Days Of July
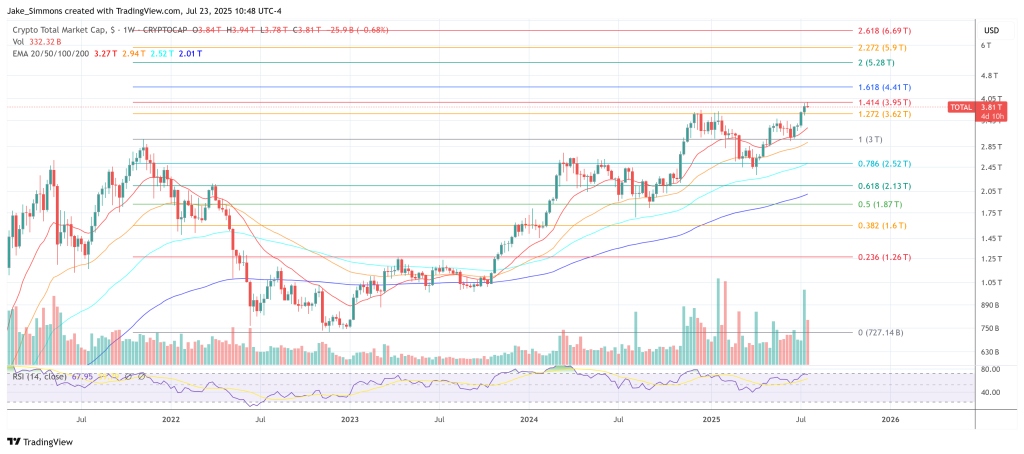
Bitcoin hovers just below its mid‑May record at roughly $119,000, while the global crypto‑asset capitalisation approaches $4 trillion, but traders say the real test will come in the last week of July, when an unusually dense cluster of US macro‑policy events collides with an intensifying legal battle over President Trump’s tariffs. “The last few days of July will set the stage for markets for the rest of the year imo. FOMC meeting where dovish dissents are looking very likely. QRA meeting where we will get a look into how willing Bessent is going to be to try to weaponize treasury issuance for the first time since being chair. Tariff letter deadlines. The Supreme Court will begin deliberating on whether tariffs via executive order are legal or not. No big edge on either side right now personally, will just react once we get clarity. Stay frosty,” Forward Guidance host Felix Jauvin wrote via X. July’s Final Days Could Shape Crypto The two‑day Federal Open Market Committee meeting on 29–30 July is the first shot. Governor Christopher Waller, speaking last week, laid out the case for an immediate 25‑basis‑point rate cut, arguing that tariff‑linked inflation looks “temporary” and that the labour market is “under strain.” Related Reading: House Passes Major Bills During ‘Crypto Week,’ But Significant Changes May Take Time Prediction‑market platform Kalshi assigns a 40 % probability to two cuts and a 13 % probability to three cuts by December; Goldman Sachs now places the first move in September, but traders emphasise that even a single dovish dissent next week would cement that timetable. As The Kobeissi Letter summed up in a widely shared post: “Rate cuts are coming … Next week’s Fed meeting will pave the path for a September rate cut.” Treasury Secretary Scott Bessent has broken with predecessors’ reticence by all but instructing the central bank to move sooner. “If [tariff] inflation isn’t sticky, they could do it sooner than September,” he told Fox News on 1 July, after stating two months earlier that “the bond market is sending a signal that the Fed should be cutting.” Only hours after the Fed decision, Bessent will unveil the Treasury’s third‑quarter borrowing plans at the Quarterly Refunding Announcement. The agenda published on 11 July flags a noon release on 30 July. Desks are watching not just the size but the maturity mix: Bessent’s advisers have floated heavier use of short‑dated bills to “manage the yield curve,” a move that would soak up the very cash that cycles into stablecoins and crypto risk. Tariffs Come Back Into Focus Trade policy is the second pressure point. A 7 July executive order extended reciprocal tariffs and launched a volley of tariff‑rate letters to trading partners; the new levies take effect on 1 August unless renegotiated. Bessent flies to Stockholm next week in a last‑minute bid to defer a mooted 100 % surcharge on Chinese imports, underscoring how fluid the landscape remains. Related Reading: 2025 Crypto Thefts Spike: Stolen Funds Hit $2.7 Billion In H1– Report Even if diplomats buy time, lawyers may not. The Court of Appeals for the Federal Circuit has set 31 July for expedited oral argument on V.O.S. Selections v. Trump, a case that could decide whether a president can impose tariffs under the International Emergency Economic Powers Act. Petitioners have already asked the Supreme Court for review before judgment, calling the tariffs a “$600 bn annual tax.” A ruling to curtail executive trade powers would remove what many bitcoin bulls see as a long‑term inflation tail‑risk; the opposite outcome could entrench the policy. Real yields—now the dominant macro driver of Bitcoin—move inversely to rate‑cut expectations and Treasury supply. The benchmark 10‑year has fallen about 30 bp in three sessions to 4.34 %, mirroring BTC’s 8 % bounce over the same period. For now, the market’s playbook is simple: Watch the Fed dots, count the bills in the QRA, read the tariff letters—and, as Jauvin advised, “stay frosty.” At press time, total crypto market cap stood at $3.81 trillion. Featured image from Shutterstock, chart from TradingView.com