
FTX to begin $1.9B payouts in September as claims no longer disputed
FTX’s next $1.9 billion distribution would unlikely include repayments to jurisdictions questioned in an earlier motion, which is currently being rewritten, according to creditors.
FTX’s next $1.9 billion distribution would unlikely include repayments to jurisdictions questioned in an earlier motion, which is currently being rewritten, according to creditors.
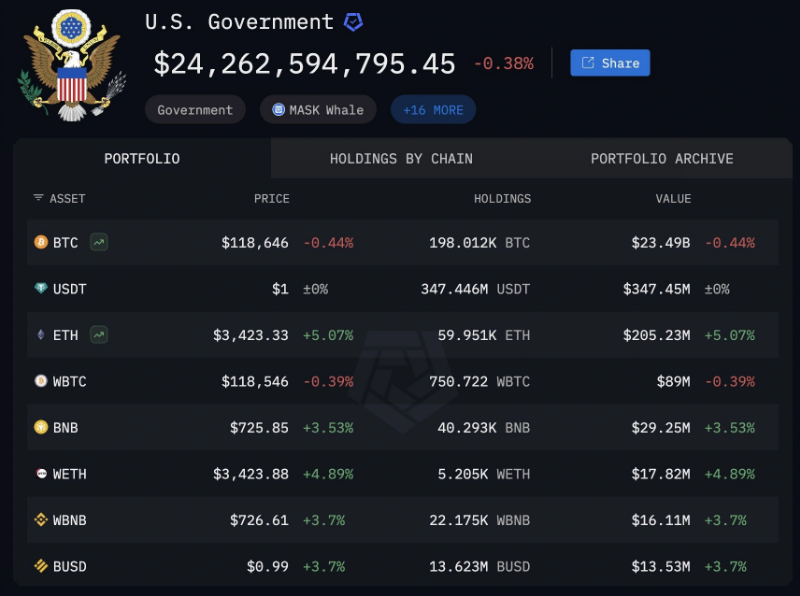
According to Arkham Intelligence, the US government still holds more than 198,000 Bitcoin. That’s around $23.4 billion sitting in digital wallets across several agencies. Related Reading: PEPE Sparks Google Frenzy With 300% Surge In Search Interest A recent public spreadsheet showed just 28,988.356 BTC under the Marshals Service. But looking at FBI, IRS, DEA and Justice Department seizures makes the total jump far higher. Government Stash Spread Across Agencies Based on reports from the Marshals Service, 28,988.356 BTC—worth roughly $3.45 billion—has been under its control since July 15, 2025. Other agencies don’t share that data publicly. They manage coins from crime probes and prize auctions. Arkham gathered on‑chain data and linked addresses tied to each agency. When added, the total hits at least 198,012 BTC. DID THE US GOVERNMENT JUST SELL 170,000 BTC ($20 BILLION)? No. This Freedom of Information Request response from the US Marshals Service (USMS) cites them as holding 28,988 BTC ($3.4B), but other departments of the US Government also seize and hold Bitcoin, including the FBI,… https://t.co/8kpjwyKcT9 pic.twitter.com/uB7EejUCVz — Arkham (@arkham) July 23, 2025 In everyday terms, that means the US is a massive bitcoin “whale” that still owns about 198,000 BTC. It’s not just sitting at the Marshals Service. The rest is spread out in hidden pockets. Those coins haven’t moved in the last four months. Traders who saw only the Marshals number panicked. Senator Cynthia Lummis even warned it would be a “total strategic blunder” if the reserves really fell below 30,000 BTC. Arkham: The US Government currently holds at least 198,000 BTC ($23.5B) across multiple addresses held by different government arms. None of this has moved for 4 months. pic.twitter.com/nhWWeWqhmh — Wu Blockchain (@WuBlockchain) July 24, 2025 Big Cases Make Up Most Holdings A huge chunk—114,599 BTC—came from the 2016 Bitfinex hack case against Ilya Lichtenstein and Heather Morgan. That haul alone counts for more than $13.65 billion. Silk Road‑related seizures add about 94,643 BTC. That breaks down into 51,680 BTC from James Zhong’s theft and 69,370 BTC linked to another hacker, sometimes called “Individual X.” Other cases help pad the total. Arkham spotted $81.25 million in BTC taken from Alameda Research’s Binance accounts after FTX collapsed. Another $79.50 million came from HashFlare scammers Sergei Potapenko and Ivan Turogin. Even small hits like 58.7 BTC from Ryan Farace’s case show up in the chain records. Sales Haven’t Touched Core Supply The US sold 9,861 BTC worth about $215 million in March 2023 from the Zhong case. In August 2024, another 10,000 BTC went for $594 million. Then in December 2024, 10,000 BTC sold for roughly $968 million. Despite that activity, the main piles from Bitfinex and Silk Road haven’t moved. Those coins still sit where seizing agencies left them. Related Reading: BREAKING – US Set To Reveal Key Crypto Report—A Make‑Or‑Break Moment For Bitcoin Without a single public ledger, each new FOIA release sparks fresh rumors. Some traders jumped at the Marshals figure and drove prices up or down on the news. But knowing the real 198,000 BTC figure could calm that. A master dashboard, updated in near real time, would help cut the drama when auctions roll around. Featured image from Getty Images, chart from TradingView
Bitcoin is trading at $118,438 on July 24, 2025, with a market capitalization of $2.35 trillion and a 24-hour trading volume of $53.99 billion. The leading cryptocurrency recorded an intraday price range between $117,422 and $119,197, reflecting ongoing consolidation near historic highs. Bitcoin On the daily chart, bitcoin remains in a defined uptrend, but recent […]

The suspects allegedly held an Italian man hostage for weeks in a Manhattan townhouse, beating him and demanding access to his Bitcoin wallet.

submitted by /u/tarkinn [link] [comments]
Tesla’s retro-themed diner opened this week with lines around the block, but that didn’t stop the stock from dipping after hours as it reported its Q2 earnings.

Jeffrey Sachs warned that the Trump administration’s potential future secondary sanctions on China’s trade relations with Russia could lead to a catastrophe for the U.S. economy. Sachs believes that the world would turn its back on America if this were to occur. Jeffrey Sachs Warns Against Enacting Secondary Trade Sanctions Against China Trade dynamics between […]

Telegram trading has been popular among many Solana investors. However, most Solana-based sniper bot cryptos had issues that derailed their performance. But that changed with the release of Snorter, which improved the Solana Sniper Bots market. Snorter is here to improve the execution times, lower costs, and offer other features that every Telegram trader needs.…
Read more

The altcoin season is ramping up, and investors are seeking promising altcoins to consider in the upcoming months. With thousands of options, finding the crypto presales can be challenging, especially for those new to the cryptocurrency market. However, in the sea of high-growth crypto projects in 2025, one project has gained notable attention. Bitcoin Hyper…
Read more
submitted by /u/ACE415_ [link] [comments]