
Strategy sets up $1.4B cash reserve, lifts Bitcoin stash to 650,000 BTC
Strategy funded a new reserve from stock sales to cover at least 12 months of dividends as it boosts its Bitcoin stash to 650,000 coins amid market volatility.
Strategy funded a new reserve from stock sales to cover at least 12 months of dividends as it boosts its Bitcoin stash to 650,000 coins amid market volatility.
Why can't Saylor respond more appropriately to ease fears about Strategy. The fact he responded the way he did makes it appear his business is insolvent and he will have to sell Bitcoin to maintain mNAV. Why couldn't he have responded different to try to convey more confidence for his investors? Is Strategy truly in…
Read more

Yearn Finance reported that a legacy yETH product was hit by an exploit that allowed an attacker to mint a massive amount of fake tokens and swap them for real assets. Related Reading: Bitcoin Miners Face A Harsh December: Rising BTC Difficulty, Falling Hashprice According to on-chain alerts and protocol statements, the attacker created a near-infinite supply of yETH in a single transaction, then used those tokens to pull ETH and liquid-staking derivatives from liquidity pools. The incident was first flagged on November 30, 2025, and the total impact has been reported at roughly $9 million. #PeckShieldAlert Yearn Finance @yearnfi suffered an attack resulting in a total loss of ~$9M. The exploit involved minting a near-infinite number of yETH tokens, depleting the pool in a single transaction. ~1K $ETH (worth ~$3M) was sent to #TornadoCash, while the exploiter’s… pic.twitter.com/IXNygpwoWa — PeckShieldAlert (@PeckShieldAlert) December 1, 2025 How The Exploit Worked Based on reports, the attacker took advantage of a flaw in the yETH minting logic and produced tokens on the order of 235 trillion in one go. Those worthless tokens were then swapped for real assets from Balancer and Curve pools tied to the product, emptying liquidity in minutes. Chain monitors and security researchers showed the mint and subsequent swaps unfolding very quickly on the blockchain. At 21:11 UTC on Nov 30, an incident occurred involving the yETH stableswap pool that resulted in the minting of a large amount of yETH. The contract impacted is a custom version of popular stableswap code, unrelated to other Yearn products. Yearn V2/V3 vaults are not at risk. — yearn (@yearnfi) December 1, 2025 What Assets Were Taken Reports have disclosed that roughly $8 million was pulled from the main yETH stable-swap pool, while about $0.9 million was taken from a yETH–WETH pool. In addition, roughly 1,000 ETH—valued at about $3 million at the time of movement—was sent to Tornado Cash in attempts to obscure the trail. The attacker converted fake yETH into a mix of ETH and liquid staking tokens before attempting to launder funds. Impact On Yearn’s Core Products According to Yearn officials and follow-up coverage, the breach was limited to an older, legacy implementation of the yETH product and did not affect Yearn’s main V2 and V3 vaults. Deposits into the affected pool were isolated while the team and outside experts began an investigation. This isolation is said to have kept the bulk of user funds in active vaults from being touched. Market Reaction And Wider Concerns Crypto markets saw selling pressure as the news spread, with traders weighing the risk that comes from combining liquid staking tokens with custom swap code. Related Reading: Bitcoin Sentiment Sparks CZ Comment: Sell Greed, Buy Fear Yearn Finance said it is working with outside security teams to run a post-mortem and to patch the vulnerability. Based on reports, teams named in coverage include external auditors and blockchain investigators who are tracking the stolen funds and advising on recovery options. The protocol’s notice warned users about the affected legacy product and urged caution while the review continues. Featured image from Unsplash, chart from TradingView

Ether ETFs roared back to life with their strongest week in a month, while bitcoin funds ended a four-week outflow streak and solana funds extended their multi-week surge. Across all three sectors, the tone shifted decisively toward accumulation. ETF Revival Week: Ether Dominates, Bitcoin Edges Up A calmer macro backdrop and renewed appetite across digital […]
submitted by /u/KazuFromUniswap [link] [comments]
We all know how much Zcash has been pumping in the past two months. Some have said the increase has been organic, while others have suspected a coordinated pump-and-dump. In recent weeks, the price has been crashing down. From the top at $720 a few weeks ago to less than $350 at the time of…
Read more
submitted by /u/KazuFromUniswap [link] [comments]

Ether price held $2,800 support amid ETF inflows and undervalued signals, but $3,000 resistance and Bank of Japan rate hike fears stopped the recovery.

submitted by /u/virentanti [link] [comments]
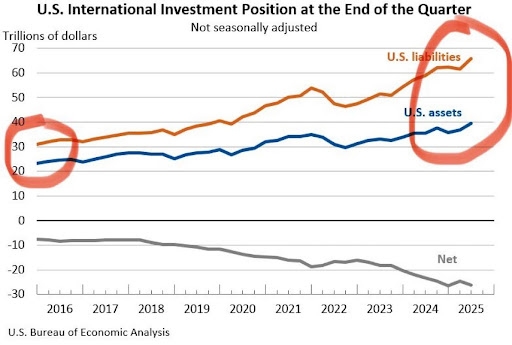
A crypto analyst has issued one of the most dramatic market calls of the year, predicting that the Bitcoin price could crash below $50,000 by 2026. However, he claims that this drop could set the stage for a historic wealth transfer. He says 2026 could become the best year for investors who stay calm and prepare for a major market reset. His reasons are closely tied to the growing economic imbalances and to key US macroeconomic indicators, which continue to tilt deeper into negative territory. Analyst Predicts Bitcoin Price Crash And 2026 Market Reset A crypto market analyst who goes by the name ‘NoLimit’ on X has shared a dramatic forecast, claiming that 2026 may be the “best year” ever and could see the biggest wealth-transfer event in more than a decade. He anticipates significant volatility in digital assets during this period and predicts that the price of Bitcoin could slip below $50,000, representing a more than 42% decline from its present price above $86,000. Related Reading: Dogecoin Just Suffered An 80% Crash In This Major Metric The analyst outlined several reasons why he believes that 2026 could become the most defining year for investors. As Bitcoin’s price declines to projected lows, NoLimit predicts the broader market will undergo a deep structural reset, which could drive declines across several economic indicators and financial assets. In his chart, the analyst referenced the widening gap between US assets and liabilities, arguing that the expanding spread is an early signal of structural weakness. That chart highlights a consistent rise in US liabilities from the roughly $30 trillion range in 2016 to above $60 trillion in 2025, while US assets climb more slowly. This gap pushes the net position further into negative territory, which the analyst indicates could trigger a broader correction in traditional markets. During the projected market reset in 2026, NoLimit anticipates a dramatic decline in US equities, warning that the S&P 500 could lose as much as 40% of its value. He believes that the correction will hit individual companies even harder. In the most extreme cases, he expects some stocks to fall by 50% to 98%, echoing the collapse of many technology firms during the dot-com crash in 2001. Gold Expected To Surge As Banks Collapse NoLimit has indicated that his projected decline in Bitcoin’s price is expected to contribute to his proposed wealth-transfer event in 2026. While BTC drops below $50,000, the analyst forecasts that gold will skyrocket to $6,500, reflecting a more than 53.6% increase from its current price of around $4,233. Related Reading: Pundit Shares XRP Fact That Will ‘Blow Your Mind’ He also warns that several banks may collapse in 2026. He believes that the recessionary pressure building beneath the surface is far worse than most expect, pointing to sky-high debt, governments and corporations burdened by cheap loans, and the $1.2 trillion commercial real estate loans set to mature between 2025 and 2026. NoLimit has indicated that these projected shifts in both economic indicators and investment assets will strain overextended investors and reward those who preserve liquidity and position themselves during the lowest point of the cycle. Featured image created with Dall.E, chart from Tradingview.com