Luna Classic (LUNC) Price Under Bearish Pull Despite New Developments
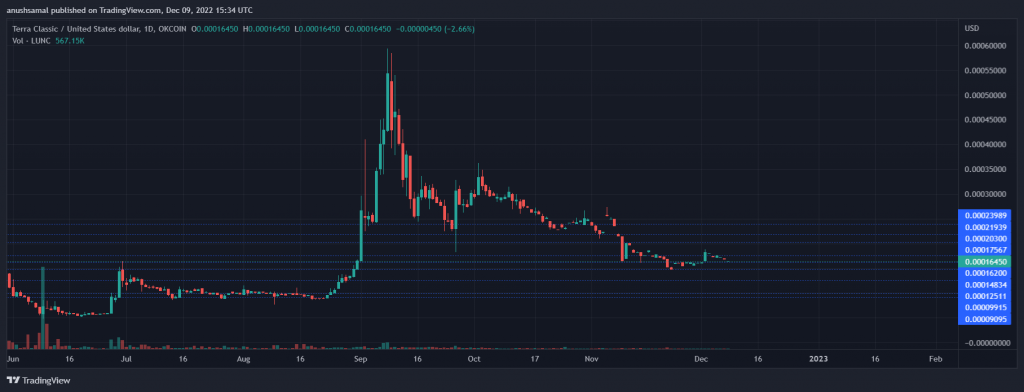
The LUNA Classic (LUNC) price has noted a fresh decline in the last 24 hours. In that time frame, the altcoin depreciated by 1%. In the past week, LUNC logged gains worth 2.5%. Much of the weekly gains have been lost due to losses on the daily chart. At the moment, LUNC depicts consolidation beneath its immediate resistance mark. With the FTX collapse, LUNC has been teetering under a bearish influence for quite some time. Over the last month, the coin has lost more than 10% of its market value. On the development front, there is a new update. This is the introduction of the new Alpha package for TerraDart. TerraDart is a Dart SDK that is used for writing applications that would be interacting with the Terra blockchain, which has launched a new package called Alpha. The Alpha package has been available to communicate with the LUNC blockchain within Flutter and Dart environments. Related Reading: Yearn Finance: What The Final Quarter Of 2022 Has In Store For YFI Price Luna Classic (LUNC) Price Analysis: One-Day Chart LUNC was exchanging hands at $0.000162 at press time. The altcoin just fell from $0.000170 due to intra-day losses. Even with developments in the ecosystem, the LUNC price remains largely unaltered. The rigid price ceiling was at $0.000175, but demand for the coin was too low for bulls to take charge. Once the altcoin topples above the $0.000175 mark, it will be an easy path to the psychological level of $0.00019. On the flip side, with lesser accumulation, LUNC would eye its closest support line of $0.000148. Falling through the $0.000148 mark will bring LUNC to $0.00012. The amount of LUNC traded in the last session was low, indicating bearish strength. Technical Analysis In the past month, the coin displayed a bullish divergence, after which LUNC noted a slight increase in price. Despite that, the bulls could not build on their strength. The Relative Strength Index was near the 40-mark, which meant that the coin was moving toward the oversold zone. Similarly, the LUNC price was below the 20-Simple Moving Average line, which denoted a lack of demand. The reading also indicates that sellers were driving the price momentum in the market. In regards to buying strength, capital inflows have also declined due to a lack of investor interest. The Chaikin Money Flow depicts capital inflows and outflows at a given point. The indicator was below the half-line which meant low capital inflows. Related Reading: Ethereum: On-Chain And Social Metrics Reveal Bulls Vs. Bears Battle – Who’s Winning? The Directional Movement Index indicates the general price direction and trend of the asset. DMI was negative as the -DI (orange) line was above the +DI (blue) line. The Average Directional Index (red) was below the 25 mark, indicating a loss of strength in the current price action. Presently, LUNC is trading at 100% lower than its all-time high secured approximately eight months ago. Featured image from Wccftech, Chart: TradingView.com