Category: Cryptocurrency News

Cryptocurrency News and Public Mining Pools

Ethereum Price Key Indicators Suggest Strengthening Case For Upside Break

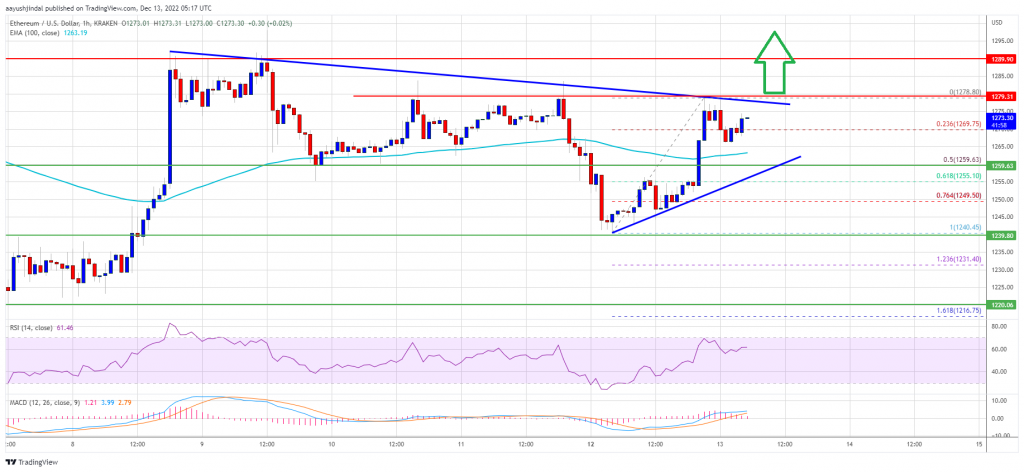
Ethereum remained supported above the $1,240 level against the US Dollar. ETH is rising and might soon attempt an upside break above the $1,300 barrier. Ethereum remained well bid above the $1,240 and $1,220 levels. The price is now trading above $1,260 and the 100 hourly simple moving average. There is a major contracting triangle forming with resistance near $1,280 on the hourly chart of ETH/USD (data feed via Kraken). The pair could start a strong increase if there is a clear move above the $1,300 barrier. Ethereum Price Eyes Upside Break Ethereum price started a downside correction from the $1,285 resistance. ETH declined below the $1,260 level and the 100 hourly simple moving average. However, the bulls were again active near the $1,240 support zone. A low was formed near $1,240 and ether price started a fresh increase, similar to bitcoin. The price climbed above the $1,260 level and the 100 hourly simple moving average. It is now consolidating near the $1,275 level. There was a test of the 23.6% Fib retracement level of the recent increase from the $1,240 swing low to $1,278 high. An immediate resistance on the upside is near the $1,280 level. There is also a major contracting triangle forming with resistance near $1,280 on the hourly chart of ETH/USD. The first major resistance is near the $1,290 and $1,300 levels. Source: ETHUSD on TradingView.com A close above the $1,300 resistance might start a strong increase. The next major resistance could be $1,340. Any more gains might send the price towards the $1,400 resistance zone. Fresh Decline in ETH? If ethereum fails to climb above the $1,280 resistance, it could start another downside correction. An initial support on the downside is near the $1,260 level and the 100 hourly simple moving average. The 50% Fib retracement level of the recent increase from the $1,240 swing low to $1,278 high is also near $1,260. The next major support is near the $1,240 level, below which the price could even retest the $1,200 support. Any more losses could lead the price towards the $1,165 support in the coming days. Technical Indicators Hourly MACD – The MACD for ETH/USD is now gaining momentum in the bullish zone. Hourly RSI – The RSI for ETH/USD is now well above the 50 level. Major Support Level – $1,240 Major Resistance Level – $1,300

Nvidia Projects Automotive Industry to Include Metaverse Tech in Its Operations in 2023

Nvidia, a graphics processing unit and artificial intelligence (AI) company, believes that 2023 could mark the start of a metaverse-driven age in the automotive industry. As part of this new conception, automotive companies will start to include metaverse tech and implement it in their industrial and retail operations. Nvidia Believes Metaverse Tech Will Be Part […]

Sen. Lummis still 'very comfortable' with Bitcoin in retirement plans

Crypto winter and calls from other senators to ban Bitcoin in retirement plans haven’t shaken the pro-crypto senator’s resolve.

Hours before his arrest, SBF denied being part of ‘Wirefraud’ chat group

SBF’s last tweet before his arrest for reportedly committing wire fraud was dispelling his involvement in a group chat purportedly called “Wirefraud.”

It's stacking up: SEC to file separate charges against FTX's SBF

SBF has finally been slapped with criminal charges and will be extradited to the U.S., once there, he will have to face separate charges from the SEC.

How at risk do you guys think binance is at risk of collapse?

I understand a lot is going on right now in the crypto world more so with exchanges, the saying never say never exists here. i never thought binance would be on the chopping block next but here we are, the sub is filled with negative news about it and now it is affecting me. I…
Read more

Crypto Twitter explodes over the news of Sam Bankman-Fried's arrest

US politicians, crypto execs, and influencers fired up their Twitter apps upon learning of Sam Bankman-Fried’s arrest in The Bahamas.

Cardano Community Expects ADA To Jump 50% By End Of Year, Is This Possible?

Cardano (ADA) has taken some of the largest hits through the bear market. The digital asset has seen massive declines that have pushed its price toward one-year lows. However, the community remains steadfast behind Cardano, and the outlook for its native ADA token shows that investors remain extremely bullish on the cryptocurrency. $0.47 For ADA By Year End The Cardano community on Coinmarketcap has shown a very bullish outlook for the future. The Price Estimates feature allows users to input a value they believe the price of a digital asset will reach by a certain time period and then provides an average of the prices. Related Reading: Bitcoin Drops Below $17,000 Pre-CPI And FOMC – Scenarios To Prepare For This Week With more than 5,000 votes already collated for the month, the average estimation came out to $0.4788 by the end of 2022. Given this current price, it means that the community expects a 57% increase in the price of ADA before the year runs out. The bullish outlook also continues to the new year as expectations fly even higher for January 2023. The estimates for this puts the price of ADA at $0.5, a 65% increase from current levels. And for the next six months, expectations remain in the green that ADA will continue to trade higher than its current value. Will Cardano Pull This Off? The Cardano community may be bullish on the future of ADA but indicators point to a very bearish trend for the digital asset. The first of these is the digital asset continues to trade consistently below its 50-day moving average, which is an important technical level for any cryptocurrency to record a bullish trend. ADA continues to stall at $0.306 | Source: ADAUSD on TradingView.com While ADA continues to hold above $0.3, it is a precarious situation for the cryptocurrency. One of these is that the cryptocurrency had previously fallen below this level in November. Presently, it is serving as support but another decline below this will see the bears mount resistance at this point. Related Reading: Inconsistent Metrics Indicate Further Struggle For SUSHI – Colder Winter Ahead? A daily close below $0.31 will be a critical blow to the token which is still trying to move out of the shadow of its 52-week low. Interestingly, it continues to stall around $0.306 ahead of the opening of the trading day which could mean some strength if the trading volume were to pick up by midday trading hours. ADA is currently trading at $0.306 at the time of this writing. The price of the digital asset is down 6.82% in the last 7 days and 2.88% in the last 24 hours. It remains the 9th largest cryptocurrency with a market cap of $10.4 billion.

Is Ripple poised to settle with SEC this week? Crypto Twitter weighs in

U.S. congressional candidate January Walker said a potential settlement would be a loss for the “whole world” and Web3.

Bitcoin NVT Golden Cross Still In “Overbought” Region, Volatility To Follow?

Data shows the Bitcoin NVT Golden Cross is still in the “overbought” region, a sign that there may be more volatility to come for the cryptocurrency. Bitcoin NVT Golden Cross Continues To Be At A High Value As pointed out by an analyst in a CryptoQuant post, the BTC long-term holders have been moving their coins recently. The “NVT ratio” is an indicator that measures the ratio between the Bitcoin market cap and the transaction volume on the chain (both in USD). What this metric tells us is whether the value of the cryptocurrency (the market cap) is comparable to the ability to transact coins or not (the volume). When the value of the metric is high, it means BTC is overvalued right now as transaction volumes are low compared to the market cap. On the other hand, low values imply the crypto may be undervalued currently. Related Reading: Quant Explains How This Nasdaq Support Retest Could Also Help Reverse Bitcoin The “NVT Golden Cross” is an indicator that compares the long-term (30-day MA) and the short-term (10-day MA) trends of the NVT ratio to identify tops and bottoms in the metric. Now, here is a chart that shows the trend in the NVT Golden Cross over the last couple of years: Looks like the value of the metric seems to have been high in recent days | Source: CryptoQuant As you can see in the above graph, the quant has marked the “overbought” and “oversold” regions in the Bitcoin NVT Golden Cross. Whenever this metric has a value of more than 2.2, it means the crypto might be overpriced right now. The coin has usually observed a bearish effect when the indicator has been in this region, as the chart displays. Related Reading: Bitcoin Drops Below $17,000 Pre-CPI And FOMC – Scenarios To Prepare For This Week The “underpriced” condition occurs in the zone where the BTC NVT Golden Cross has values less than -1.6. In the image, there is also the chart for the “supply adjusted dormancy,” an indicator that tells us whether long-term holders are selling or not currently. It seems like the LTHs have been possibly participating in a large degree of selling recently. This metric has an influence on the NVT Golden Cross, which has also risen in the last few weeks. The indicator is now in the overbought region, which suggests Bitcoin may soon be seeing some bearish volatility. BTC Price At the time of writing, Bitcoin’s price floats around $17k, down 2% in the last week. Over the past month, the digital asset has gained 1% in value. The chart below shows the trend in the price of the coin over the last five days. BTC seems to have plunged during the last day | Source: BTCUSD on TradingView