Category: Cryptocurrency News

Cryptocurrency News and Public Mining Pools

Advice on building EVM indexing tools

We have built a web3 on-chain marketing tool. Dapps can use our dashboards to find out the relevant wallet addresses who could be their potential customers, Once selected, They can reach out to them. We are using Google big query ethereum public dataset to fetch relevant blockchain data. Is there any other tool which we…
Read more

Bitcoin’s Mining Difficulty Expected to Drop Significantly, Retarget Could Be 2022’s Largest Reduction

Bitcoin miners could catch a break in a week or so, on or around Dec. 5, 2022, as the next difficulty retarget is expected to see a significantly large reduction. Estimates show the next difficulty retarget could drop anywhere between 6.13% and 10% lower. Presently, the difficulty change looks as though it could be 2022’s […]

Crypto is Dead

These are the words I’m starting to see from article after article and it’s making me even more bullish than before. This makes me think we may be near the bottom. Also, the fact that everyone and their brother is predicting another huge crash and capitulation tells me that once again, we’re probably near the…
Read more

Historic Bitcoin Miner Capitulation In Full Effect – How Long Will It Last?

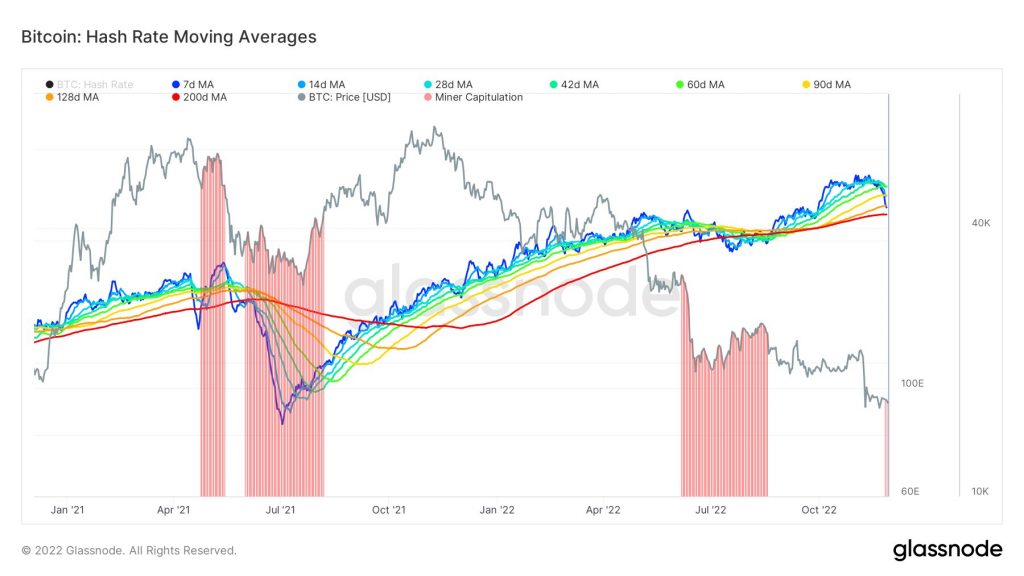
The collapse of the crypto exchange FTX is causing a historic event in the Bitcoin market. Yesterday, on-chain data signaled the second wave of a Bitcoin miner capitulation in one cycle. Historically, miners have had a massive impact on the BTC price. The now heralded miner capitulation will put further selling pressure on the Bitcoin price, which is experiencing a historically bad November, down 21%. On-chain data shows that the second wave of miner capitulation has now begun, suggesting further pain for the BTC price. As analyst Dylan LeClair wrote, the Bitcoin hash rate is starting to tilt here. Bitcoin Miners Under Water The 7-day moving average hash rate is now 13.7% away from its all-time high. Mining difficulty is expected to adjust by about -9% in a week, which will take some pressure off miners, at least in the short term. Nevertheless, miner margins have been and continue to be massively squeezed since June, the first capitulation event in this cycle. Despite this, the hash rate still rose to an all-time high until recently. This, the increased mining difficulty, and the FTX-related price crash have pushed the hash price to its lowest level since late 2020. Related Reading: Ethereum Price Key Indicators Point Firming Case For Recovery Above $1,250 As Capriole Investments’ Charles Edwards noted yesterday, hash ribbons have confirmed the start of capitulation. “Triggered by the $10 billion FTX scam and subsequent collapse, bitcoin miners are now going broke and the hash rate is trending down,” Edwards stated. In the “Bitcoin miner net position change” chart, it can be seen that miners have been selling aggressively over the past month. “Combined with the decline in the hash rate and today’s hash band bear cross, this suggests that we are indeed in a phase of miner capitulation,” said Will Clemente of Reflexivity Research. How Long Will Miner Capitulation Last? Something to keep in mind is that miner capitulation is usually the last stage of a Bitcoin bear market. In the 2018 cycle, the BTC hashrate continued to rise as the price reached the $6,000 mark until the final miner capitulation came at $3,000. In the current cycle, miners have already undergone a capitulation in June. They reduced their holdings by 4,000 BTC, equivalent to about $68 million, in the last two weeks. Related Reading: Bitcoin At $1,000: Looking Back At Nine Years Of Bull Run Prior to that, they had only begun a net accumulation trend in September 2022, betting that the bottom had been reached. However, they bet on the wrong horse and are now being severely punished. Historically, miner capitulation has lasted an average of 48 days, which would put an end to miner selling pressure in sight by mid-January 2023. However, the most recent capitulation ended only after two months, on August 18. The end marked the third longest capitulation in history. Bitcoin bulls should therefore be cautious in December and January, and watch the behavior of Bitcoin miners. At press time, BTC saw a slight uptick and was trading at $16,481.

Polkadot (DOT) Clings To $5 Level Despite Unforgiving Bear Market

Polkadot (DOT), the 11th largest cryptocurrency with an overall valuation of nearly $6 billion, continues to keep its losses in this prevailing crypto winter to minimal levels. On November 8, despite the negative effects of the collapse of the FTX exchange platform, the digital asset managed to briefly surpass the psychological $7 marker, peaking at $7.38. DOT wasn’t able to sustain this gain and quickly abandoned the territory, hovering around the $6 region before eventually falling to the $5 range which it continues to maintain despite the ongoing bear market. According to latest tracking from Coingecko, Polkadot is trading at $5.13 at the time of this writing, being down by only 1.3% over the last seven days. Despite painting its chart in red, the digital asset has so far parried all the heavy blows of this bear cycle responsible for making the crypto market cap go down by almost 2% during the last 24 hours. Related Reading: Ethereum Tries To Keep Luster As ETH Moves To Narrower Trading Range Polkadot Focuses Energy On Areas It Can Win As its trading price and total market capitalization continues to be at the mercy of the winter season for crypto space, Polkadot has turned its focus on aspects where it can emerge victorious and enjoy positive developments. For example, the nomination pools for the project successfully achieved a milestone when the current number of DOT bonded by members of its pool surpassed the 500,000 marker. Last week, at the time when industry leaders Bitcoin and Ethereum failed to make any kind of move to turn the tides on their favor, social mentions and engagements for Polkadot both increased. According to social analytics platform LunarCrush, during that time, the project tallied a 68.9% jump on its social mention numbers and an equally impressive 71.4% increase on its social engagements. It proved that despite all the FUD that have been ravaging the space for quite some time now, interest for Polkadot network and its DOT crypto asset remained high. What Awaits DOT Towards End Of 2022? Owing to the fluctuating price of DOT at the start of the current year, crypto experts have forecasted that the asset will exit the month of November with an average price of $5.70. However, as it is currently changing hands at $5.13, the altcoin might need to perform a bit of a surge during the next few hours to end November with a value that is close to the forecast. Meanwhile, the predictions for the month of December for Polkadot is almost the same as its average price next month is expected to be at $5.86, with the digital coin going as high as $6.08 in terms of trading price. Related Reading: BCH Price: Investors May Not Want To Go Long Yet On BCH – Here’s Why DOT total market cap at $5.9 billion on the daily chart | Featured image from Cryptopolitan, Chart: TradingView.com

Nexo’s business model

Good morning, I really appreciate some good due diligence or a nice discussion but using out of context numbers and including a lot of doom doesn't make any substantial Analysis. It's just spreading fear and doubt. First of all, Nexo survived the 2018 bear market that was magnitudes worse. Furthermore Credissimo is a established bank…
Read more

Crypto exchange Bitfront shuts down

submitted by /u/Gastellier [link] [comments]

LBRY alleges Apple forced it to censor certain terms during COVID-19

After Elon Musk lamented the winding back of Apple’s Twitter advertising, crypto company LBRY replied about its own troubles with Apple and censorship.

Litecoin Price Prediction: Why LTC Could Hit $100 and Outperform Bitcoin

Litecoin price started a steady increase above the $65 resistance against the US Dollar. LTC is currently rising and might rally further towards the $100 level. Litecoin started a strong increase above the $55 and $65 levels against the US Dollar. The price is now trading above $65 and the 100 simple moving average (4-hours). There is a key bearish trend line forming with resistance near $77.50 on the 4-hours chart of the LTC/USD pair (data feed from Kraken). The price must clear the $77.50 and $84 to rise towards the $100 resistance zone. Litecoin Price Outperforms Bitcoin In the past few days, litecoin price saw a decent increase above the $50 level against the US Dollar. LTC price rallied over 20% and outperformed both bitcoin and ethereum. There was a move above the $65 and $75 resistance levels. The price even surpassed $80 and settled above the 100 simple moving average (4-hours). It traded as high as $83.35 before there was a downside correction. There was a move below the $80 and $75 support levels. The price declined below the 23.6% Fib retracement level of the upward move from the $59.17 swing low to $83.35 high. However, litecoin price is now trading above $65 and the 100 simple moving average (4-hours). It stayed above the 50% Fib retracement level of the upward move from the $59.17 swing low to $83.35 high. On the upside, an immediate resistance is near the $77.50 level. Source: LTCUSD on TradingView.com There is also a key bearish trend line forming with resistance near $77.50 on the 4-hours chart of the LTC/USD pair. If there is a clear break above the $77.50 resistance, the price could start a strong increase. In the stated case, the price is likely to continue higher towards the $85 and $90 levels. Any more gains might send ltc price towards the $100 resistance zone. Dips Limited in LTC? If Litecoin price fails to clear the $77.50 resistance level, there could be another pullback. An initial support on the downside is near the $71.20 level. The first major support is forming near the $68 level. Any further losses may perhaps send the price towards the $55 support in the coming sessions. Technical indicators: 4-hours MACD – The MACD is slowly moving into the bullish zone. 4-hours RSI (Relative Strength Index) – The RSI for LTC/USD is currently above the 50 level. Major Support Levels – $71.20 followed by $68.00. Major Resistance Levels – $77.50 and $85.00.