Bitcoin Hash Rate at Near All-Time High despite Rising Mining Difficulty
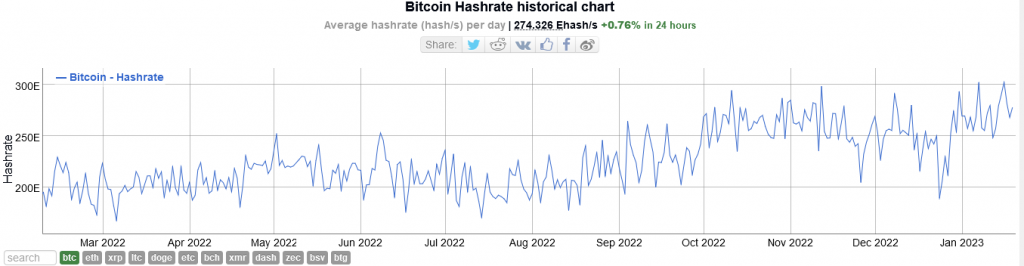
The Bitcoin hash rate is trending at near all-time highs, per on-chain data on January 20, 2023. Bitcoin Hash Rate at 274 EH/s According to streams from BitInfoCharts, the Bitcoin network currently has a hash rate of 274 EH/s, up by almost one percent in the past 24 hours. Even at this pace, the hash rate is down from January 16 highs of 302 EH/s. Related Reading: Bitcoin Price Bulls In Check, Signs of Fresh Increase above $21.5K Hash rate is the measure of computing power dedicated to BTC mining. As a proof-of-work platform, the Bitcoin network depends on a community of node operators using Application Specific Integrated Circuit (ASIC) gear for block confirmation and security. ASICs are special nodes explicitly designed to mine cryptocurrencies in proof-of-work networks using, among others, the SHA-256 consensus algorithm. ASICs that can mine BTC can also be used to mine its forks, adhering to a proof-of-work system, including Bitcoin Cash. For confirming a block, a miner is rewarded with BTC. The amount of computing power channeled to the Bitcoin network often fluctuates depending on many factors, including the cost of scarce gear, often from Bitmain, and the price of BTC. In recent years, chipset manufacturers, led by Bitmain, have been tuning their equipment, making them more efficient in power consumption. At the same time, they are packing them with more power. Accordingly, the latest BTC ASICs can dispense more computing power. As an illustration, the Bitmain Antminer S19 XP released in July 2022 can produce 140 TH/s while using 3010W. Meanwhile, the older versions, like Bitmain Antminer S17+, can generate 76.00 TH/s while using more power at 3040W. Improving efficiency coupled with rising prices may explain the rising hash rate. Since miners are likely to power their gear as Bitcoin prices recover, the hash rate might bounce, even to new all-time highs, in the months ahead. This will be especially true if BTC prices continue to maintain the current trajectory. After months of lower lows in 2022, Bitcoin appeared to have bottomed up in November 2022 at $15,300. Prices are now trending above $20,000, according to TradingView charts. Mining Difficulty Adjusted Upwards Hash rate trends and difficulty readings are proportional. In response to the rising hash rate, near all-time highs, the network automatically increased mining difficulty by double digits to 10.26% on January 16. The difficulty was adjusted upwards by 13.55% on October 10, 2022. Mining difficulty in Bitcoin changes depending on the hash rate. With more computing power, miners can extract more coins within the allocated 10-minute block-producing time. Bitcoin ensures that this never happens by increasing difficulty, making confirming a block more tasking and consuming more resources. In this way, the 10-minute block-producing time is retained, and the network continues to function as designed, regardless of the investment made by miners. Related Reading: Bitcoin Might Fall Below $20,000 Before Bull Rally Resumes, Analyst Says In their observation, Binance, which also operates a mining pool, said if BTC prices rise above $23,000, miners using efficient miners would still turn in a profit despite the upward difficulty adjustment. Feature image by Alexander Ryumin/Tass via Getty Images, chart from TradingView.com