Category: Cryptocurrency News

Cryptocurrency News and Public Mining Pools

These Top 5 Cryptos Are Seen Making Big Moves This Week

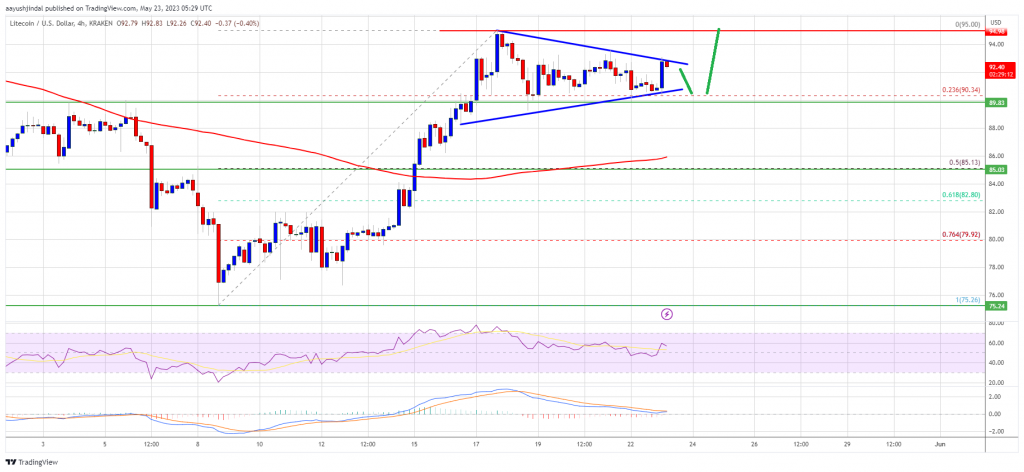
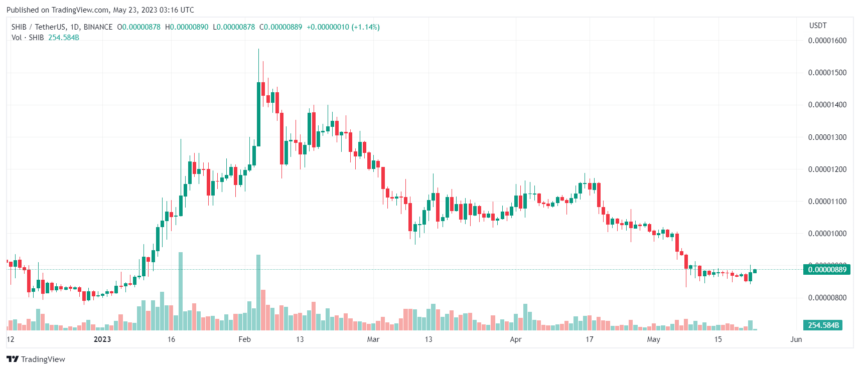
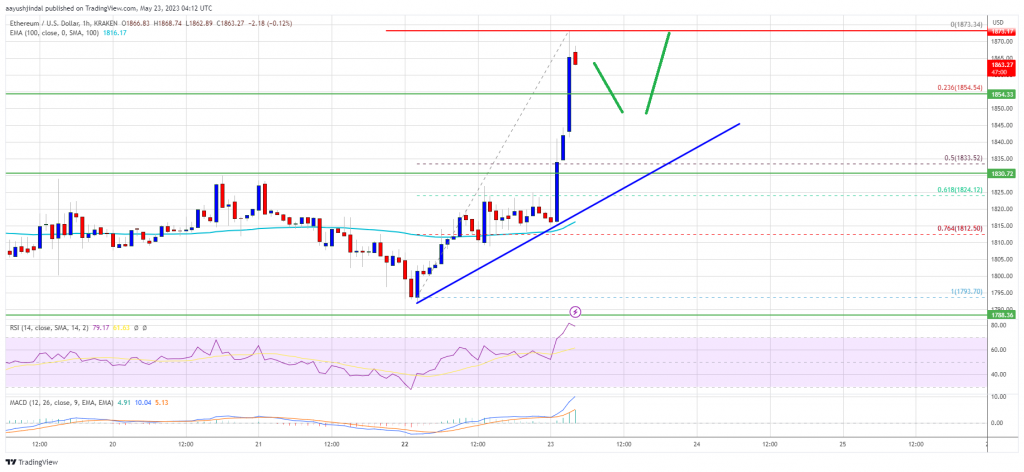
The top 5 cryptos are treading cautiously as Bitcoin enters its narrowest trading range, reminiscent of July 2020 prices, according to Glassnode. Consolidating within its tightest seven-day range in three years, Bitcoin’s movement indicates an imminent significant shift in the days ahead. Amidst the cautious sentiment in the broader financial market following a recent debt ceiling meeting, which has prompted bearishness, there is a possibility that the bearish trend affecting Bitcoin could extend to the crypto market in the medium to long term. However, these top 5 cryptos hold the potential to shield against significant downside risks and offer investors profitable returns once bullish sentiment returns to the markets. Related Reading: Shiba Inu Struggles To Initiate A Breakout: Will It Defy Resistance And Rebound? Top 5 Cryptos Expected To Make Big Moves In Coming Days KAVA With the successful launch of the ecosystem’s Kava 13 mainnet, its governance token KAVA made some impressive stats. According to CoinGecko, the token is up 50% in the past two weeks. The increased utility and scalability of the newly launched mainnet will surely contribute to KAVA’s future performance.  SUCCESSFUL LAUNCH: #KAVA 13 Mainnet is LIVE 🚀 pic.twitter.com/wU3peIIMe7 — Kava (@KAVA_CHAIN) May 18, 2023 At the moment, the token’s $0.8465 support level holds the key toward a bigger upside. The current price movement of the token suggests a drop in value might occur in the coming days. Defending this price point will be crucial to target $1.4 resistance in the coming days.  SNX  Powering synthetic assets on the blockchain, Synthetix’s governance token SNX continues to go against the market’s current movement. As of writing, the token is up an impressive 15% in a market where major cryptocurrencies lost value. Lyra, a new options market maker on the block, will also integrate Synthetix perpetuals in its Newport upgrade which will bring more attention to Synthetix.  For investors, holding $2.334 will be important for future price actions. However, SNX’s correlation with Bitcoin might pose a problem in the short term. Despite this, $2.334 should be able to hold against any bearishness in the medium to long term. TRX The recent conclusion of Tron’s HackaTron Season 4 produced winners that will help develop DeFi and crypto as a whole. It gave TRX a boost away from the market’s current slippage. Coingecko data reveals that the token’s value has increased by 11% since last week.  The token’s current trajectory places it as a prime target for the bears. After nearly a month of continuous gains, investors should be ready for a drop toward $0.06544 in the short term. Despite this, the bulls should be able to target $0.08092 in the long term once the market cools down its bearishness.  Thrilled to announce our official integration with @Port3Network ‘s SoQuest platform 🎉! Now, you can utilize SoQuest to earn valuable rewards 🏆, craft your unique on-chain identities 🆔, and explore so much more! Buckle up for this exhilarating blockchain journey! 🚀 https://t.co/l07MVJtaVz — Conflux Network Official (@Conflux_Network) May 17, 2023 CFX Conflux has been able to keep building despite the market conditions present with multiple integrations on other networks. These developments positively affected CFX’s price, with the token up nearly 30% in the past two weeks, making it one of the biggest gainers in the market.  As of writing, bulls are trying to recover $0.3128. A return on this level will provide a solid support level for CFX to settle above $0.4215 in the coming days or months. However, investors and traders should monitor Bitcoin’s future price movements as the two assets are historically correlated with each other. Crypto total market cap nearly unchanged at $1.06 trillion on the daily chart at TradingView.com Related Reading: Role Reversal: Ethereum Defies Expectations With Lower Volatility Than Bitcoin LTC’s Hashrate is a prime metric and plays a crucial role in the strength and security of the Litecoin network. The future is bright #Litecoin ⚡ pic.twitter.com/9Gff8Iqk6K — Litecoin (@litecoin) May 22, 2023 LTC Being the oldest crypto on the list, Litecoin holds itself higher than the others listed. Boasting a very high hashrate, this coin proves to be a reliable way to transact in everyday life. Due to these factors, LTC is up nearly 17% since last week.  Bitcoin’s movement toward a tight trading range is affecting LTC’s future performance. At the moment, the asset is holding above $89.32 which can open the path towards higher gains. For the long term, investors and traders should be able to target $100 to secure a bigger upside.  -Featured image from Futurist Speaker

Litecoin Price Prediction: LTC Could Surge 10% If It Clears This Resistance

Litecoin price is attempting an upside break above $93 against the US Dollar. LTC could rally if it clears the $93 and $95 resistance levels. Litecoin is slowly moving higher toward $95 against the US Dollar. The price is now trading above $90 and the 100 simple moving average (4 hours). There is a key contracting triangle forming with resistance near $92.50 on the 4-hour chart of the LTC/USD pair (data feed from Kraken). The price could rally toward the $100 and $105 levels. Litecoin Price Eyes Upside Break After a steady increase, Litecoin’s price struggled near the $95 resistance against the US Dollar. LTC price started a downside correction and traded below the $92 level. The price tested the 23.6% Fib retracement level of the upward move from the $5.26 swing low to the $95.00 high. However, the bulls seem to be protecting a downside break, unlike Bitcoin and Ethereum. Litecoin is now consolidating above the $90 level. It is trading above $90 and the 100 simple moving average (4 hours). There is also a key contracting triangle forming with resistance near $92.50 on the 4-hour chart of the LTC/USD pair. Source: LTCUSD on TradingView.com On the upside, immediate resistance is near the $93 zone. The next major resistance is near the $95 level. If there is a clear break above the $95 resistance, the price could start another strong increase. In the stated case, the price is likely to continue higher toward the $100 and $105 levels. Any more gains might send LTC’s price toward the $112 resistance zone. Fresh Decline in LTC? If Litecoin price fails to clear the $95 resistance level, there could be a fresh decline. Initial support on the downside is near the $91 level and the triangle lower trend line. The next major support is forming near the $85 level or the 50% Fib retracement level of the upward move from the $5.26 swing low to the $95.00 high, below which there is a risk of a move toward the $80 support. Any further losses may perhaps send the price toward the $75 support. Technical indicators: 4-hour MACD – The MACD is now gaining pace in the bullish zone. 4-hour RSI (Relative Strength Index) – The RSI for LTC/USD is above the 50 level. Major Support Levels – $91.00 followed by $85.00. Major Resistance Levels – $93.00 and $95.00.

Ledger CEO says ‘sharded’ wallet keys could be shared if subpoenaed

The private seed phrases of Ledger users could be shared with governments if they are ordered to, but this is “not a real concern,” says CEO Paul Gauthier.

Coinbase to roll out ‘Moving America Forward’ national campaign for crypto

submitted by /u/CryptoIsThePlan [link] [comments]

Shiba Inu Burn Rate Spikes After A Few Stagnant Days

After a few days of stagnation, the Shiba Inu community seems to have picked up its token-burning mechanism. A report from Shiba Inu’s token burn aggregator, Shibburn, indicates that the SHIB Army has significantly raised the burning rates within the past 24 hours. The data showed that the community destroyed 50.18 million SHIB tokens in 24 hours. SHIB Burn Rate Picks Up After Some Days Of Decline The SHIB burn rate surged 8,627% over the past 24 hours compared to the previous day. The burning process was completed through two transfers: the burn of 39,511,911 and 10,676,779 SHIB tokens. Cumulatively, the community moved about 3.09 billion SHIB tokens to the dead wallet within the past week. As of Saturday, May 20, the Shiba Inu burn rate for the week showed a surge of 666% for the past week. Related Reading: Bitcoin Price Double Fractal Points To “Extended” Parabolic Rally Further, the Shiburn website shows the Shiba Inu community collectively destroyed 410,642,087,431,967 SHIB tokens. Currently, the meme coin has about 574,308,140,003,340 SHIB coins as its total circulating supply. Shibarium Token Burn Details Excites The SHIB Army The layer 2 solution network of Shiba Inu, Shibarium, has made tremendous progress while still in the beta-test phase. The Shiba Inu team, under the leadership of the pseudonymous Shytoshi Kusama, disclosed the SHIB burning mechanism on Shibarium. According to details, fees for all transactions completed on Shibarium are paid in BONE. The basic fees for all transactions are locked on a contract on the network, while the validators will get priority fees. The network will set aside a total of 30% of the fees for maintenance purposes. However, it will burn the remaining 70% of the fees.  A Twitter user, SHIB INFORMER, shared a screenshot of Sharium’s interface of the network’s token burning mechanism. Related Reading: Why Bitcoin May Have Completed The “Perfect” Pullback Users can initiate a burning process if the locked BONE exceeds 10 BONE. The network will automatically convert the locked tokens to SHIB coins and transfer them to the protocol’s dead wallet. SHIB Price Gains, Increasing Whale Activities At the time of writing, Shiba Inu is trading at $0.00000890, indicating an increase of 1.46% over the past 24 hours. The value of SHIB saw a slight gain over the weekend after it fell from $0.00000873 to $0.00000871 on May 19. The meme coin has been trying to sustain its hold throughout the bearish wave on Sunday. Following Shiba Inu’s price gain during the weekend, data from analytics firm, IntoTheBlock revealed that more SHIB whales amassed the token.  According to the data, investors grabbed over 26.2 trillion SHIB tokens over the past weeks. Also, some whales sold their Shiba Inu holdings, with a cumulative value of 300 billion SHIB coins disposed of. -Featured image from Pexels and chart from Tradingview.com

Ethereum Price Sees Bullish Breakout And Why Dips Turn Attractive

Ethereum price climbed above the $1,840 resistance against the US Dollar. ETH is showing positive signs and might aim a move toward the $1,920 resistance. Ethereum is currently gaining pace above the $1,840 resistance zone. The price is trading above $1,820 and the 100-hourly Simple Moving Average. There is a key bullish trend line forming with support near $1,835 on the hourly chart of ETH/USD (data feed via Kraken). The pair could rise further if it stays above the $1,835 and $1,820 support levels. Ethereum Price Gains Bullish Momentum Ethereum’s price formed a base above the $1,800 support level. ETH started a decent increase above the $1,820 resistance level and averted more losses, similar to Bitcoin. There was a clear move above the $1,830 and $1,840 resistance levels. The price even spiked above $1,870. A high is formed near $1,873 and is currently consolidating gains above the 23.6% Fib retracement level of the recent wave from the $1,793 swing low to the $1,873 high. Ether is now trading above $1,820 and the 100-hourly Simple Moving Average. There is also a key bullish trend line forming with support near $1,835 on the hourly chart of ETH/USD. Immediate resistance is near the $1,880 zone and the recent higher. The first major resistance is near the $1,920 level. A close above the $1,920 resistance could spark more bullish moves. The next resistance sits near $1,940, above which Ethereum could rise toward $2,000. Source: ETHUSD on TradingView.com If the bulls remain in action, Ethereum could rise toward $2,040. Any more gains above the $2,040 resistance zone could start a steady increase toward the $2,120 resistance. Are Dips Supported in ETH? If Ethereum fails to clear the $1,880 resistance, it could start a downside correction. Initial support on the downside is near the $1,850 level. The next major support is near the $1,835 zone and the trend line. It is close to the 50% Fib retracement level of the recent wave from the $1,793 swing low to the $1,873 high. The main support sits at $1,820. If there is a close below the $1,820 support, the price could move into a bearish zone. In the stated case, the price might drop toward the $1,780 support zone. Technical Indicators Hourly MACD – The MACD for ETH/USD is losing momentum in the bullish zone. Hourly RSI – The RSI for ETH/USD is above the 50 level. Major Support Level – $1,830 Major Resistance Level – $1,880

Coinbase to roll out 'Moving America Forward' national campaign for crypto

The ads will emphasize the financial innovations facilitated via crypto and raise awareness for Coinbase events and lobbying efforts.

Everything XRP holders have been shouting has ‘been confirmed’ — Pro-XRP lawyer

Pro-XRP lawyer John Deaton has eagle-eyed a small footnote in a Ripple brief that purportedly confirms XRP was discussed among SEC staff prior to the Hinman speech.

Prominent Crypto Trader Drops Shocking Bitcoin Price Prediction

While Bitcoin price exchanges hands above the $27,000 price level, iconic trader Peter Brandt dropped a new prediction for it.  The trader believes it could take one more price pullback for BTC to climb higher. Nonetheless, Brandt calls this price forecast a guess, adding that guessing is the best he can offer.  Brandt told his followers to run and protect their assets from anyone dogmatic about his price analytics. “…If anyone is dogmatic about their brilliance, turn and run, protecting your wallet,” he wrote. Major BTC Price Breakout Could Be Imminent Bitcoin traded bearish in the last few days, with a 0.8% price decline over the past 24 hours. Though BTC closed May 21 with a slight price increase, the asset remains below the primary pivot point, trading at $27,132 at press time. Related Reading: Bitcoin Price Double Fractal Points To “Extended” Parabolic Rally According to data by notable blockchain analytics firm, Glassnode, Bitcoin recorded a 3.4% price range in the last seven days. The data confirms the number one crypto asset is witnessing one of its tightest periods in the last three years.  According to the analytic firm, the current price movement aligns with the bearish trading recorded in January 2023 and July 2020.  These two intervals preceded large market moves, suggesting that high volatility is probably near, added Glassnode. This observation concurs with Brandt’s latest prediction, where he claims Bitcoin would thrust higher after one more shakeout.  Meanwhile, Brandt isn’t the only analyst who thinks that a price breakout, after some pullbacks, is on the horizon.  Crypto analyst Carl from the Moon had spotted a symmetrical triangle pattern, indicating consolidation. Carl highlighted a target of 25K or $29K, depending on the direction of the price breakout. Surging Bitcoin Transaction Fees Constitute A Lackluster To Potential Bull Runs Although technical indicators suggest a major price move for Bitcoin, Glassnode’s recent reports noted that the surging network fee drives the market lower.  BTC transaction fees have skyrocketed as the Bitcoin network struggles with congestion due to massive unconfirmed transactions. According to reports, the network congestion was due to increased minting and transferring of Ordinal NFTs and BRC20 tokens. The network flooded with transactions, causing node overloads and an overwhelmingly large backlog of unconfirmed transactions. Related Reading: Why Bitcoin May Have Completed The “Perfect” Pullback This issue slowed down transaction speed and triggered a hike in transaction fees. It has equally repelled users from conducting Bitcoin transactions, reducing transfer volumes.  As of May 20, the total transfer volume in the Bitcoin network had reduced to $2.73 billion per day. That’s a significantly lower throughput than the over 15 trillion recorded during the 2021 bull market. -Featured image from Pexels, Chart from TradingView

Binance off the hook from $8M Tinder ‘pig butchering’ lawsuit

The plaintiff, a Texan woman, initially blamed Binance for losing $8 million in a pig butchering scam that began on Tinder.