Month: October 2024

Cryptocurrency News and Public Mining Pools

XRP Price Stands Firm Amid Bitcoin’s Dip: A Sign of Strength?

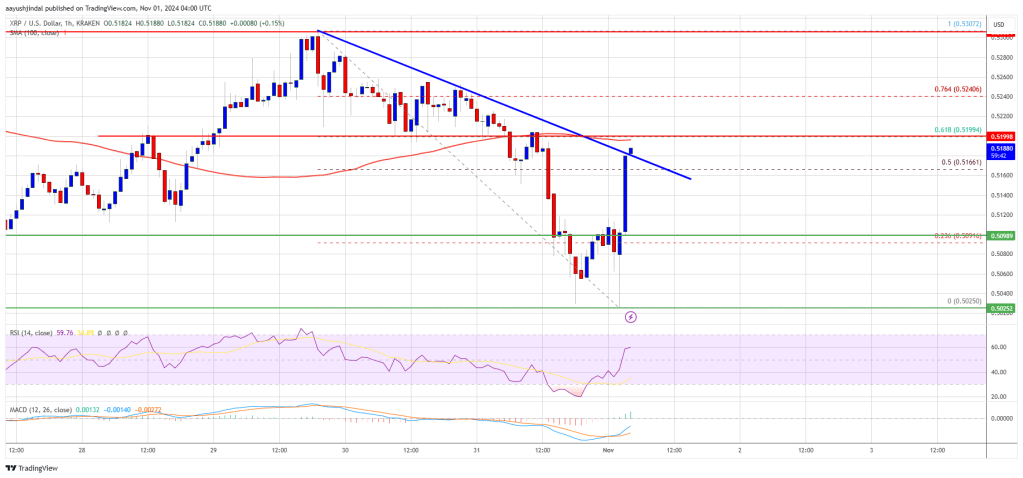
XRP price is holding the $0.5020 support zone. The price is beating Bitcoin and might aim for a move above the $0.5250 resistance. XRP price is eyeing more gains above the $0.5250 zone. The price is now trading below $0.5200 and the 100-hourly Simple Moving Average. There was a break above a key bearish trend line with resistance at $0.5185 on the hourly chart of the XRP/USD pair (data source from Kraken). The pair could gain bullish momentum if it settles above the $0.5200 resistance zone. XRP Price Eyes Upside Break XRP price extended losses below the $0.5120 support zone. The price even declined below $0.5050 before the bulls emerged, but losses were limited compared to Bitcoin and Ethereum. A low was formed at $0.5025 and the price started a fresh increase. There was a move above the $0.5050 and $0.5120 resistance levels. It cleared the 50% Fib retracement level of the downward move from the $0.5307 swing high to the $0.5025 low. Besides, there was a break above a key bearish trend line with resistance at $0.5185 on the hourly chart of the XRP/USD pair. The price is now trading below $0.5200 and the 100-hourly Simple Moving Average. On the upside, the price might face resistance near the $0.5200 level or the 61.8% Fib retracement level of the downward move from the $0.5307 swing high to the $0.5025 low. The first major resistance is near the $0.5240 level. The next key resistance could be $0.5300. A clear move above the $0.5300 resistance might send the price toward the $0.5350 resistance. Any more gains might send the price toward the $0.5500 resistance or even $0.5550 in the near term. The next major hurdle might be $0.5850. Another Decline? If XRP fails to clear the $0.5200 resistance zone, it could start another decline. Initial support on the downside is near the $0.5120 level. The next major support is near the $0.5085 level. If there is a downside break and a close below the $0.5085 level, the price might continue to decline toward the $0.5020 support in the near term. The next major support sits near the $0.4880 zone. Technical Indicators Hourly MACD – The MACD for XRP/USD is now gaining pace in the bullish zone. Hourly RSI (Relative Strength Index) – The RSI for XRP/USD is now above the 50 level. Major Support Levels – $0.5150 and $0.5085. Major Resistance Levels – $0.5200 and $0.5240.
India Reclaims 102 Tonnes of Gold From Bank of England as Global Risks Rise

The Reserve Bank of India has repatriated 102 tonnes of gold from the UK, bolstering domestic reserves as global instability fuels demand for secure assets. 102 Tonnes of Gold Returned: RBI Shifts Assets From Bank of England India’s central bank, the Reserve Bank of India (RBI), has returned 102 tonnes of gold from the Bank […]

CleanSpark targets 400MW Bitcoin mining capacity after acquiring GRIID

CleanSpark CEO Zach Bradford said it was a strategic move for the firm to increase its mining capacity in Tennessee. 

Coinbase sees largest single-day decline in 2 years amid stock market wipeout

Coinbase’s share price experienced its largest daily drop in over two years amid a broader stock market decline, yet traders remain bullish on the firm’s earnings prospects for 2025.

Ethereum Price Tumbles: Will It Find a Way Back Up?

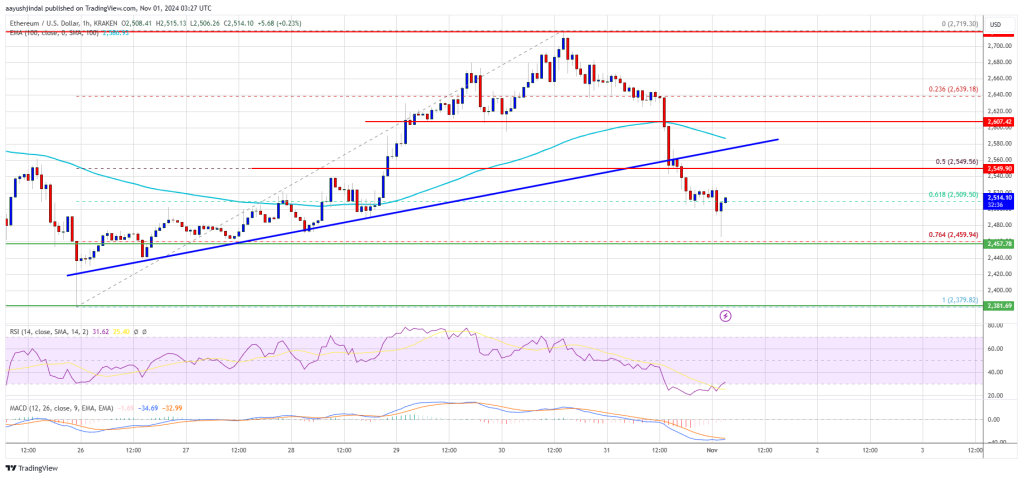
Ethereum price started a fresh decline from the $2,720 resistance. ETH is back below $2,550 and might struggle to start a fresh increase in the short term. Ethereum started a fresh decline from the $2,720 resistance zone. The price is trading below $2,550 and the 100-hourly Simple Moving Average. There was a break below a key bullish trend line with support at $2,560 on the hourly chart of ETH/USD (data feed via Kraken). The pair could extend losses if it fails to stay above the $2,450 support zone. Ethereum Price Dives Below $2,550 Ethereum price struggled to stay above $2,650 and started a fresh decline like Bitcoin. ETH declined heavily below the $2,620 and $2,600 levels. There was a break below a key bullish trend line with support at $2,560 on the hourly chart of ETH/USD. The pair declined below the 50% Fib retracement level of the upward wave from the $2,488 swing low to the $2,719 high. The bears even pushed the price below $2,550. Ethereum price is now trading below $2,550 and the 100-hourly Simple Moving Average. It is now approaching the $2,460 support zone and the 61.8% Fib retracement level of the upward wave from the $2,488 swing low to the $2,719 high. On the upside, the price seems to be facing hurdles near the $2,550 level. The first major resistance is near the $2,580 level. The main resistance is now forming near $2,610. A clear move above the $2,610 resistance might send the price toward the $2,650 resistance. An upside break above the $2,650 resistance might call for more gains in the coming sessions. In the stated case, Ether could rise toward the $2.720 resistance zone. More Downsides In ETH? If Ethereum fails to clear the $2,550 resistance, it could continue to move down. Initial support on the downside is near the $2,480 level. The first major support sits near the $2,450 zone. A clear move below the $2,450 support might push the price toward $2,380. Any more losses might send the price toward the $2,320 support level in the near term. The next key support sits at $2,250. Technical Indicators Hourly MACD – The MACD for ETH/USD is gaining momentum in the bearish zone. Hourly RSI – The RSI for ETH/USD is now below the 50 zone. Major Support Level – $2,450 Major Resistance Level – $2,550

Bitcoin Set To Gain If Trump Wins, JPMorgan Cites ‘Debasement Trade’ As Key Factor

According to JPMorgan analysts, a win for the Republican US presidential candidate Donald Trump could further fuel Bitcoin (BTC) price momentum. Retail Investors Turn To Bitcoin For ‘Debasement Trade’  In a recent client note, analysts at JPMorgan suggested that a Trump win might provide ‘additional upside’ for both BTC and gold, as retail investors increasingly view Bitcoin as a ‘debasement trade.’ Related Reading: Bitcoin Makes ATH Against Euro Due To Change In Dollar Strength, Details Inside In simple terms, a debasement trade is a strategy to protect purchasing power against the steady erosion of fiat currencies due to extensive money printing. Notably, the M2 money supply – a measure of total money in circulation – sharply rose during the coronavirus pandemic. This surplus in money supply led to heightened inflation, forcing the U.S. Federal Reserve (Fed) to raise interest rates to contain it. By purchasing BTC, retail investors aim to maintain their money’s value, hoping Bitcoin will act as a hedge against currency depreciation. The JPMorgan note states: Retail investors appear to be embracing the ‘debasement trade’ in an even stronger manner by buying bitcoin and gold ETFs. The retail impulse is also seen in meme and AI tokens the market cap of which has outperformed. Data from SoSoValue shows that Bitcoin exchange-traded funds (ETF) have attracted a whopping $1.3 billion in inflows over the past two days alone. As of October 30, the cumulative net inflow to US-based spot BTC ETFs is $24.18 billion. October’s total ETF inflows alone amount to $4.4 billion, marking it the third-highest month for BTC ETF inflows since their launch earlier this year. However, institutional investors appear to have slowed down on BTC futures activity recently, with analysts noting that Bitcoin futures have entered overbought territory, potentially introducing vulnerability for BTC’s near-term outlook. The client note highlights that credit and prediction markets lean toward a Trump win, unlike equities, foreign exchange (FX), and rates markets. The analysts conclude: Overall, to the extent a Trump win inspires retail investors to not only buy risk assets but to also further embrace the ‘debasement trade’, there could be additional upside for bitcoin and gold prices in a Trump win scenario. Where Is BTC Headed? Analysts Share Their Outlook Bitcoin is trading within 2% of reaching a new all-time high (ATH), driving renewed optimism among crypto analysts. Related Reading: Bitcoin Retail Demand Rises 13% In 1 Month: Time For Q4 2024 Rally? For instance, crypto analyst Timothy Peterson recently posited that BTC could surge to as high as $100,000 by February 2025. Meanwhile, crypto options trading data indicates that traders remain confident BTC will hit $80,000 by the end of November 2024, regardless of the election outcome. Veteran trader Peter Brandt, however, has urged caution, advising BTC bulls that a daily close above $76,000 is critical for confirming a true breakout. At the time of writing, BTC is trading at $71,798, down 0.1% in the past 24 hours. Featured image from Unsplash, Charts from FRED and Tradingview.com

A 36-Digit Debt: Google’s Penalty in Russia Climbs Beyond Imagination

Google faces a spiraling fine from Russia, surpassing two undecillion rubles and doubling weekly, with potential service blocks looming as tensions escalate. Google and the Unending Fine: How a 36-Digit Debt May Be Just the Start Tech giant Google now owes over two undecillion rubles to the Russian government, a 36-digit sum that doubles daily […]

Bitcoin Price Takes a Sharp Dip: Is This Just a Correction?

Bitcoin price is correcting gains from the $73,500 zone. BTC is back below the $70,000 level and showing a few bearish signs. Bitcoin started a fresh decline from the $73,500 zone. The price is trading below $71,500 and the 100 hourly Simple moving average. There was a break below a key bullish trend line with support at $70,000 on the hourly chart of the BTC/USD pair (data feed from Kraken). The pair is showing a few bearish signs and might test the $68,500 support zone. Bitcoin Price Trims Gains Bitcoin price failed to trade to a new all-time and started a downside correction from the $73,500 resistance zone. There was a move below the $72,500 and $72,000 support levels. The price dipped below the 50% Fib retracement level of the upward wave from the $65,531 swing low to the $73,575 high. Besides, there was a break below a key bullish trend line with support at $70,000 on the hourly chart of the BTC/USD pair. The price is down over 5% and there was a move below $70,000. Bitcoin price is now trading below $70,000 and the 100 hourly Simple moving average. It is now approaching the $68,500 support zone and the 61.8% Fib retracement level of the upward wave from the $65,531 swing low to the $73,575 high. On the upside, the price could face resistance near the $70,000 level. The first key resistance is near the $70,500 level. A clear move above the $70,500 resistance might send the price higher. The next key resistance could be $71,200. A close above the $71,200 resistance might initiate more gains. In the stated case, the price could rise and test the $72,500 resistance level. Any more gains might send the price toward the $73,200 resistance level. Any more gains might call for a test of $73,500. More Downsides In BTC? If Bitcoin fails to rise above the $70,000 resistance zone, it could continue to move down. Immediate support on the downside is near the $68,800 level. The first major support is near the $68,500 level. The next support is now near the $67,400 zone. Any more losses might send the price toward the $66,500 support in the near term. Technical indicators: Hourly MACD – The MACD is now gaining pace in the bearish zone. Hourly RSI (Relative Strength Index) – The RSI for BTC/USD is now below the 50 level. Major Support Levels – $68,500, followed by $67,400. Major Resistance Levels – $70,000, and $71,200.

Crypto.com Announces Acquisition of SEC Registered Broker-Dealer

Crypto.com Announces Acquisition of SEC Registered Broker-Dealer Watchdog Capital, LLC SEC Registered Broker-Dealer and Member of FINRA and SIPC Licensed to Offer Equities and Equity Options for Traders in the U.S. This acquisition will enable Crypto.com’s new subsidiary to offer equities and equity options, among other things, to eligible traders in the U.S. With this…
Read more