Author: dfmines

Cryptocurrency News and Public Mining Pools

Coinbase CEO Brian Armstrong and Trump Reportedly Hold Private Discussion

According to “people familiar with the matter” who spilled the beans to the Wall Street Journal (WSJ), Coinbase CEO Brian Armstrong reportedly met with U.S. President-elect Donald Trump on Monday. WSJ reporter Brian Schwartz claims the meeting would be the first since Election Day on Nov. 5 and the two will discuss “personnel appointments for […]

Metaplanet To Expand Bitcoin Holdings With $11.3 Million Bond Sale

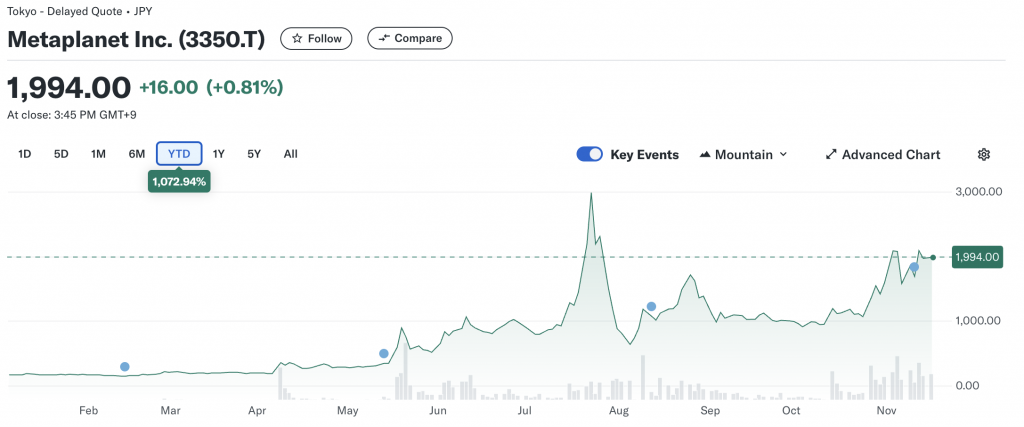
In an announcement today, Japanese firm Metaplanet revealed plans to increase its Bitcoin (BTC) holdings by issuing $11.3 million worth of bonds to fund the purchase. Metaplanet To Increase BTC Holdings Through Bond Issuance The Tokyo-listed company announced on November 18 that its Board of Directors had approved a debt sale with a guarantee worth 1.75 billion yen, or approximately $11.5 million. The bonds will have a one-year maturity period, maturing on November 17, 2025, and will carry an interest rate of 0.36% per annum. Related Reading: MicroStrategy’s Bitcoin Bet Pays Off In Multiple Ways As Stock Surges 317% The proceeds from the bond issuance will be used solely to purchase BTC. It’s worth noting that Metaplanet already holds 1,018 BTC on its balance sheet. Often referred to as “Asia’s MicroStrategy,” Metaplanet’s latest BTC acquisition announcement comes just a week after the US-based business intelligence firm MicroStrategy purchased 27,200 BTC, worth approximately $2.03 billion at current market prices. Metaplanet began acquiring BTC as a strategic treasury reserve asset in April. The company announced it was adopting a “Bitcoin-first, Bitcoin-only” approach, mirroring MicroStrategy’s BTC investment strategy. Since April, the early-stage investment firm has steadily expanded its Bitcoin portfolio. For instance, the company acquired an additional 20.195 BTC in June, worth roughly $1.2 million.  It added another 38.464 BTC in September, valued at approximately $2 million. Most recently, in October, the firm announced it had purchased 156.78 BTC, bringing its total holdings to over 1,000 BTC. Despite the announcement of the bond issuance, Metaplanet’s share price saw little movement. The firm’s share closed the day with a modest 0.81% increase on Monday. However, since the company began its Bitcoin acquisition strategy, its stock has experienced explosive growth. On April 4, 2024, Metaplanet’s shares traded at 190 yen ($1.23). Today, they trade at 1,994 yen ($12.86), reflecting gains of nearly 950% in just over seven months. Bitcoin Supply Scarcity To Further Propel Price? With increasing retail, institutional, and even sovereign demand, Bitcoin’s limited supply could lead to a supply shock, potentially driving the digital asset’s price to unprecedented levels. As a reminder, BTC’s total supply is capped at 21 million by design. Related Reading: Bitcoin Continues To Exit Exchanges As Supply Drops To New 2024 Low According to a recent analysis by a CryptoQuant analyst, BTC reserves on cryptocurrency trading platforms have fallen to a five-year low. The analyst also noted that more investors hold Bitcoin long-term as a hedge against rising inflation and currency debasement. Similarly, a recent report suggests that BTC demand vastly exceeds its supply. This growing supply-demand imbalance may set the stage for Bitcoin’s next major price breakout.  BTC trades at $90,909 at press time, up 0.1% in the past 24 hours. Featured image from Unsplash, Charts from Yahoo! Finance and Tradingview.com

Solana (SOL) Could Soon Rally Past $250—Are Bulls in Control?

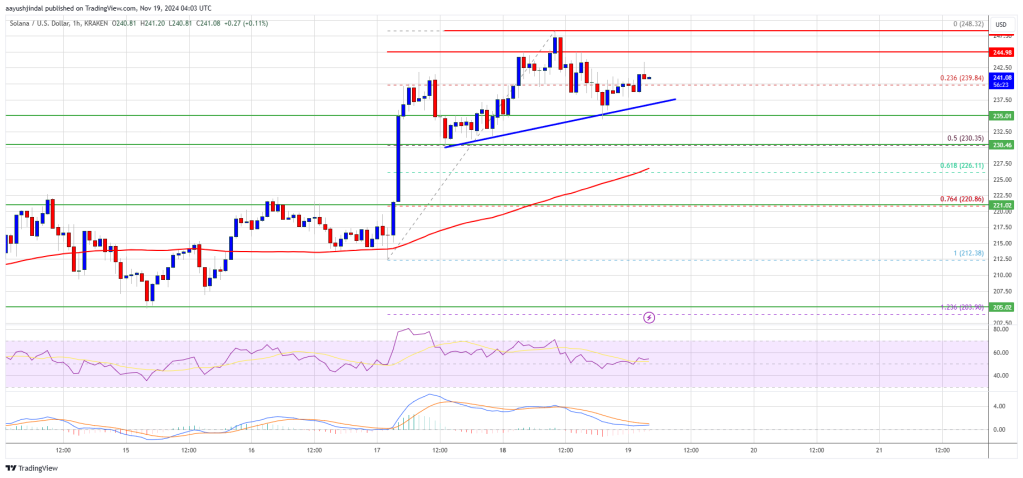
Solana started a fresh increase above the $220 zone. SOL price is consolidating gains and might aim for an upside break above the $250 resistance. SOL price started a fresh increase after it settled above the $200 level against the US Dollar. The price is now trading above $225 and the 100-hourly simple moving average. There is a connecting bullish trend line forming with support at $237 on the hourly chart of the SOL/USD pair (data source from Kraken). The pair could start a fresh increase if the bulls clear the $250 zone. Solana Price Eyes More Upsides Solana price formed a support base and started a fresh increase above the $220 level beating Bitcoin and Ethereum. There was a strong move above the $225 and $240 resistance levels. The price even cleared the $245 level. A high was formed at $248 and the price is now consolidating gains. There was a move below the $245 and $242 levels. The price dipped below the 23.6% Fib retracement level of the upward move from the $212 swing low to the $248 high. Solana is now trading above $230 and the 100-hourly simple moving average. There is also a connecting bullish trend line forming with support at $237 on the hourly chart of the SOL/USD pair. On the upside, the price is facing resistance near the $245 level. The next major resistance is near the $248 level. The main resistance could be $250. A successful close above the $250 resistance level could set the pace for another steady increase. The next key resistance is $265. Any more gains might send the price toward the $282 level. Are Dips Supported in SOL? If SOL fails to rise above the $245 resistance, it could continue to move down. Initial support on the downside is near the $237 level and the trend line. The first major support is near the $230 level or the 50% Fib retracement level of the upward move from the $212 swing low to the $248 high. A break below the $230 level might send the price toward the $220 zone. If there is a close below the $220 support, the price could decline toward the $212 support in the near term. Technical Indicators Hourly MACD – The MACD for SOL/USD is gaining pace in the bullish zone. Hourly Hours RSI (Relative Strength Index) – The RSI for SOL/USD is above the 50 level. Major Support Levels – $237 and $230. Major Resistance Levels – $245 and $250.

Mexican crypto trading bot scheme disappears with 3,000 users’ funds

submitted by /u/ChemicalAnybody6229 [link] [comments]

Ransomware’s Mastermind Faces Justice: DOJ Targets Global Cybercrime Operation

A Russian ransomware kingpin extradited from South Korea to the U.S. faces charges for orchestrating the $16 million Phobos malware targeting global critical infrastructure. Justice Catches Up: The Fall of a Ransomware Kingpin The U.S. Department of Justice (DOJ) announced Monday that Evgenii Ptitsyn, a 42-year-old Russian national, has been extradited from South Korea to […]

Bitcoin Price Forecast: Fundstrat Sees BTC ‘Comfortably’ Over $100,000 This Year

Tom Lee, the head of research at independent financial analysis firm Fundstrat, has reiterated his optimistic outlook for the Bitcoin price, predicting that the cryptocurrency is on track to reach the $100,000 mark before the year concludes.  Optimistic Bitcoin Price Outlook In a recent appearance on CNBC’s Squawk Box, Lee discussed the implications of the political landscape following Donald Trump’s victory over Kamala Harris in the presidential election, suggesting that Bitcoin could play a pivotal role in the upcoming administration. Lee articulated that Bitcoin could serve as a solution to some of the United States’ fiscal challenges, particularly if it is designated as a national reserve asset—a promise made by Trump earlier this year at the National Bitcoin Conference in Nashville.  Related Reading: Trump Social Media Firm In Talks To Expand Into Crypto With Bakkt Acquisition The Fundstrat executive also highlighted Bitcoin’s robust security features and its underlying blockchain technology, arguing that these elements position it as a viable alternative to some existing financial structures.  Lee believes that Bitcoin’s attributes could address several issues inherent in the current economic framework, further boosting its appeal among investors. When discussing his price forecast, Lee expressed confidence, stating, “I think comfortably over $100,000 makes sense before the end of the year.”  Lee noted that the current Bitcoin price trajectory is consistent with historical patterns observed during previous Halving cycles, events that typically reduce the rate at which new BTC are created and ultimately have a positive impact on price action. Key Support Levels Identified Crypto analyst Ali Martinez also provided insights into the current Bitcoin price price dynamics, but drawing parallels with historical market behavior. He noted that during the 2017 bull market, Bitcoin surged by 156% beyond its previous all-time high before experiencing a significant correction of -39%.  Similarly, in 2020, Bitcoin rose 121% prior to a -32% pullback. Based on these patterns, Martinez suggests that Bitcoin could potentially reach at least $138,000 before facing its first major correction. Further analyzing past trends, Martinez pointed out that after Bitcoin broke its previous all-time high of $19,700 in 2020, it initially surged by 26%, consolidated for about a week, and then jumped to $40,000.  Currently, Bitcoin has increased by 28% after surpassing its previous all-time high and has been consolidating for the past six days, leading Martinez to speculate that history might be repeating itself. However, he also cautioned that Bitcoin could be on the verge of a steep correction. He highlighted a growing sense of greed among crypto enthusiasts as evidenced by a notable spike in Google search interest for Bitcoin, reflected in the profits realized by investors, who have collectively taken home over $5.42 billion. Related Reading: MicroStrategy Makes Record $4.6 Billion Bitcoin Purchase, Largest Yet From a technical analysis standpoint, Martinez flagged the TD Sequential indicator, which has presented a sell signal on Bitcoin’s daily chart. Additionally, the Relative Strength Index (RSI) suggests that Bitcoin is currently in overbought territory, signaling potential for a price pullback. In the event of a correction, Martinez identified key support levels to monitor, specifically between $85,800 and $83,250, as well as further down at $75,520 to $72,880.  The analyst emphasized that for a bullish outlook to remain intact, the Bitcoin price needs to maintain a sustained daily close above $91,900. Such a close could invalidate the bearish sentiment and potentially trigger a breakout toward a target of $100,680. As of this writing, the leading digital asset is trading at $90,970, up nearly 2% in the 24-hour time frame.  Featured image from DALL-E, chart from TradingView.com

Flair for You, And You, And You! /r/ethereum gettin’ some bling. Enjoy.

submitted by /u/jtnichol [link] [comments]

XRP Price Holds Strong, Aiming for More Upside Moves

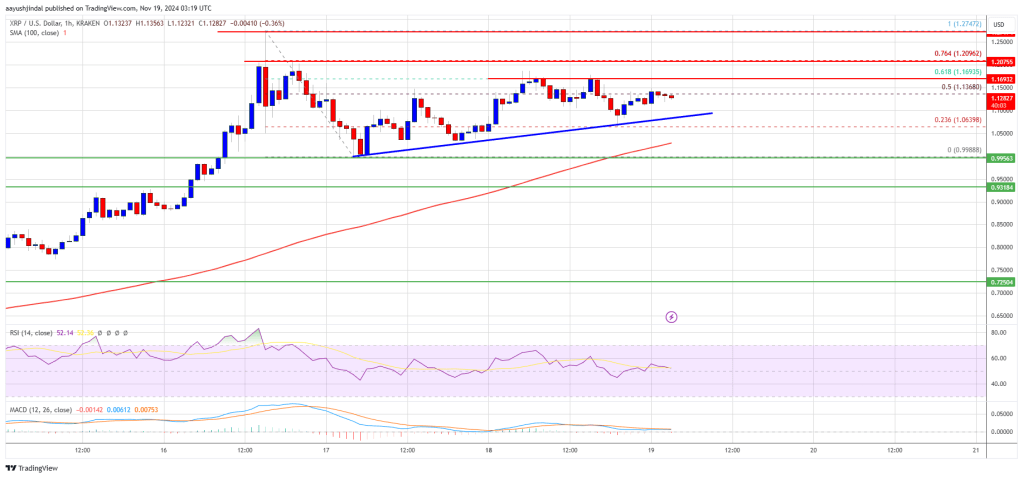
XRP price is consolidating gains above the $1.050 support zone. The price could soon aim for more gains above the $1.180 resistance zone. XRP price started another increase above the $1.080 resistance. The price is now trading above $1.0850 and the 100-hourly Simple Moving Average. There is a key bullish trend line forming with support at $1.100 on the hourly chart of the XRP/USD pair (data source from Kraken). The pair could soon gain bullish momentum if it stays above the $1.00 support zone. XRP Price Aims Higher XRP price formed a base above the $1.00 level and recently started a fresh increase. It outperformed Bitcoin and Ethereum with a move above the $1.050 and $1.080 resistance levels. The price climbed above the 50% Fib retracement level of the downward move from the $1.2745 swing high to the $0.9988 low. The bulls even pushed the price above the $1.150 resistance level before the bears appeared. It seems like the price faced resistance near $1.170. The 61.8% Fib retracement level of the downward move from the $1.2745 swing high to the $0.9988 low is acting as a hurdle. However, there is a key bullish trend line forming with support at $1.100 on the hourly chart of the XRP/USD pair. The price is now trading above $1.080 and the 100-hourly Simple Moving Average. On the upside, the price might face resistance near the $1.1680 level. The first major resistance is near the $1.200 level. The next key resistance could be $1.2740. A clear move above the $1.2740 resistance might send the price toward the $1.3220 resistance. Any more gains might send the price toward the $1.3500 resistance or even $1.3620 in the near term. The next major hurdle might be $1.450. Are Dips Supported? If XRP fails to clear the $1.1680 resistance zone, it could start a downside correction. Initial support on the downside is near the $1.100 level and the trend line. The next major support is near the $1.060 level. If there is a downside break and a close below the $1.060 level, the price might continue to decline toward the $1.000 support in the near term. The next major support sits near the $0.980 zone. Technical Indicators Hourly MACD – The MACD for XRP/USD is now gaining pace in the bullish zone. Hourly RSI (Relative Strength Index) – The RSI for XRP/USD is now above the 50 level. Major Support Levels – $1.1000 and $1.0600. Major Resistance Levels – $1.1700 and $1.2000.

Ethereum Price Readies for a Fresh Climb: Will Momentum Build?

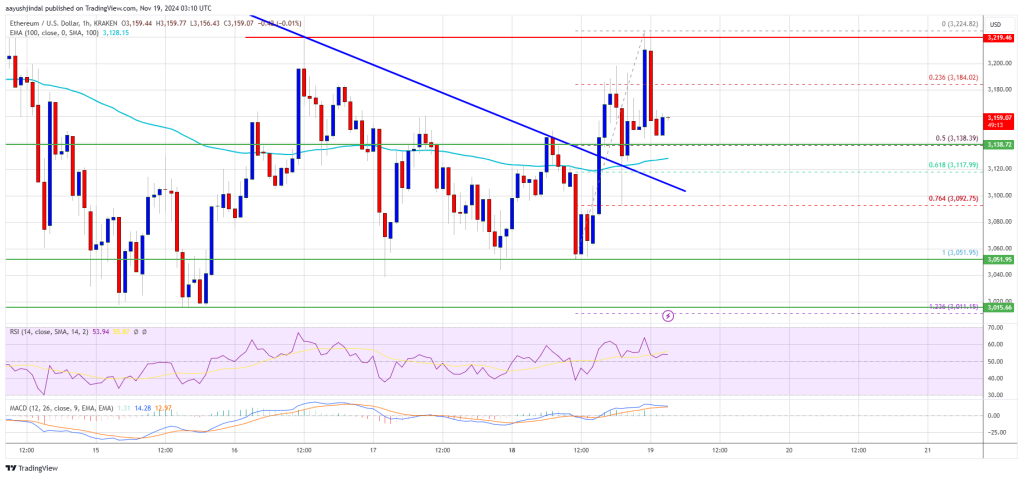
Ethereum price started a consolidation phase near the $3,000 zone. ETH is slowly moving higher and might aim for a fresh surge above $3,220. Ethereum is consolidating and facing hurdles near $3,220. The price is trading above $3,150 and the 100-hourly Simple Moving Average. There was a break above a key bearish trend line with resistance at $3,130 on the hourly chart of ETH/USD (data feed via Kraken). The pair could start a fresh increase if it clears the $3,220 resistance zone. Ethereum Price Faces Hurdles Ethereum price remained supported above the $3,000 level like Bitcoin. ETH formed a base and recently moved above the $3,120 and $3,150 resistance levels. There was a break above a key bearish trend line with resistance at $3,130 on the hourly chart of ETH/USD. The pair even cleared the $3,200 level and tested $3,220. A high was formed at $3,224 before there was a pullback. The price dipped below the 23.6% Fib retracement level of the upward move from the $3,051 swing low to the $3,224 high. Ethereum price is now trading above $3,150 and the 100-hourly Simple Moving Average. On the upside, the price seems to be facing hurdles near the $3,200 level. The first major resistance is near the $3,220 level. The main resistance is now forming near $3,250. A clear move above the $3,250 resistance might send the price toward the $3,320 resistance. An upside break above the $3,320 resistance might call for more gains in the coming sessions. In the stated case, Ether could rise toward the $3,450 resistance zone. Another Drop In ETH? If Ethereum fails to clear the $3,220 resistance, it could start another decline. Initial support on the downside is near the $3,140 level or the 50% Fib retracement level of the upward move from the $3,051 swing low to the $3,224 high. The first major support sits near the $3,050 zone. A clear move below the $3,050 support might push the price toward $3,000. Any more losses might send the price toward the $2,940 support level in the near term. The next key support sits at $2,880. Technical Indicators Hourly MACD – The MACD for ETH/USD is gaining momentum in the bullish zone. Hourly RSI – The RSI for ETH/USD is now above the 50 zone. Major Support Level – $3,140 Major Resistance Level – $3,220

Kevin Owocki from Gitcoin has a new book for pre-order. “How To DAO”

submitted by /u/jtnichol [link] [comments]