Yet another Bitcoin cycle analysis
| |
Back in February 2024, I posted some analysis looking at Bitcoin cycles not by the halving date, but how each cycle performed from the low. Original post link:
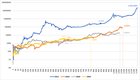
So let's see how this updated chart looks: X-axis represents the number of days from each cycle's low. Y-axis represents the % growth from that cycle's low. The dot marker for each line represents the halving date for that cycle. Bitcoin price multiple from each cycle low (e.g. 2024 low was $15,780 on 11/22/2024) As we can see, 2024 (yellow line) is tracking almost perfectly to the 2016 cycle, but slightly lower than 2020. According to this chart, we are currently on day 770 of this bull cycle. Previous cycles have taken almost 1,100 days to reach their ATH from the low, indicating that we may be looking at a new ATH in Q4 2025. Thats financial advice, loser. Time to take out a HELOC and yolo it all. What this chart doesn't take into account are any macro economic conditions. Obviously there's been a ton of noise around inflation for our current cycle. This time last year, all the big brains were saying Bitcoin's bull cycle was dead, killed by the highest Fed Funds Rate in a decade. Well guess what gaylords: Bitcoin eclipsed $100k, and hit $108k, with a FFR of 4.75%. Another new variable in this cycle, as we all know, are the Bitcoin ETFs. Well right now, the top 5 ETFs hold 1.05 MILLION BITCOIN. That's 5% of the total mined supply. Taking into account the estimated lost bitcoin increased that to 7%. 7%! In less than a year! And large financial institutions, wealth managers, 401ks, etc. still have yet to adopt! The bullish impact on supply is staggering to comprehend. And lastly, of course the regulatory change implications from the new administration are in play. Bullish news I'm looking for in 2025:
TLDR; get in the rocket loser, we're headed to the moon. submitted by /u/Slimalicious |