This is a guide on an advanced version of the Dollar-Cost Averaging (DCA) Strategy. It still shares some of the disadvantages of DCA-ing, but tries to improve it. And also adds a 'taking profits' dimension to it.
This is for investors who are in-between conventional investing strategies and active trading but don't want to do either. Typically investors who are more risk-adverse or like to dive into some technical aspects of the market. More on crypto investing strategies here.
Risk-Adjusted Dollar-Cost Averaging
The idea of this strategy is to use some sort of risk-metric to trigger DCA-In or -Out decisions. This makes it so that you have some sort of gauge for overvalued or undervalued prices with which you can guide your buying or taking profit decisions. There are a bunch of metrics out there so feel free to explore. These are some of the more popular ones.
Note: While these models have 'stood the test of time' to some degree, you cannot expect them to continue being correct. Right now, Bitcoin and crypto is in a convenient position because Bitcoin's value has since gone according to halving cycles and other cryptos have mimicked Bitcoin's price action and volatility. More on market correlation here.
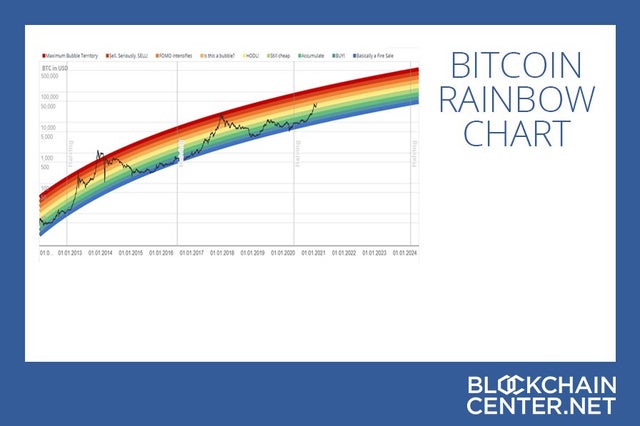
Bitcoin Logarithmic Rainbow
https://preview.redd.it/gqdwgp2284971.png?width=2226&format=png&auto=webp&s=3d1b1b3bef6ea5d97733d789c64704e95db2fa9a
- The bitcoin log-rainbow, introduced in 2014, uses logarithmic regression and The Law of Diminishing Returns to provide a better view of long-term prices.
- DCA-In or buy at blue to yellow levels. Be a spectator at orange levels. DCA-out at dark-orange to red levels.
- Today, we're between yellow ($40k) and green ($30k) which is a signal for me to start DCA-ing.
- If you used this strategy for the current cycle, you barely would've had any chances to sell as Bitcoin only touched dark-orange a few times. And that's okay assuming most people speculate that this isn't the 'market peak' and we still have more in store.
Bitcoin Stock-to-Flow Model
https://preview.redd.it/n4jw7ay284971.png?width=2462&format=png&auto=webp&s=8f175d8cfa1a47b789e7dd7077725c41c7ea5874
- The stock-to-flow model, created by Plan B, is an attempt to put a value to Bitcoin based off scarcity.
- This website in particular has a nice chart at the bottom that indicates overvalued (red) and undervalued (green) levels based on divergence between the model and Bitcoin's actual price.
- DCA-In when the chart below is green and DCA-Out when the chart below is red.
- Right now, we're in green which, again, is a signal for me to start DCA-ing. Actually we're at one of the lowest-levels right now at -0.82 variance: levels we haven't seen since 2011, 2013, and 2018 cycles.
- If you used this model in the current cycle, you would've been DCA-ing out and taking profits between December 2020 ($27k) to March 2021 ($58k).
Crypto Fear and Greed Index
https://preview.redd.it/3y7k8cw384971.png?width=1438&format=png&auto=webp&s=918e478dc810c6f0cba40d20784de937a84bcdac
- The Bitcoin Fear and Greed Index uses a mixture of volatility, volume, dominance, and sentiment analysis from social media and Google trends.
- DCA-In during times of fear and DCA-Out during times of Greed. In other words, be "fearful when others are greedy, and greedy when others are fearful," as Warren Buffet advices.
- Right now, we're in fear-levels, so that's another signal for me to start DCA-ing. Similar to the Stock-to-Flow model, we're experiencing some of the most fearful levels in history.
- This metric is much more volatile compared to the other two. If you used this model in the current cycle, you would've been selling at November 2020 to February 2021 with some dips in January, capturing moments of correction.
Tips
I know these metrics are all based on Bitcoin but that's just the reality of the space as of now. That give you some insight as to why 'the market moves with Bitcoin'. Most of the time-tested metrics have to use Bitcoin. You can trade other currencies based on these metrics and, yes, you will get varying results as some alts spike earlier or later than others. But, for the most part, these metrics speak for the cryptocurrency market.
As you can see, none of these models are perfect or even capable of predicting prices, market peaks, and bottoms. They are also not always coordinated with one another, with one indicator indicating a 'buy' zone while the others do not. Here are some tips when using this strategy:
- Determine your own DCA strategy. This strategy is a trigger for your DCA strategy, so you should still set an interval (weekly, bi-weekly, monthly, etc.) and an amount to buy or sell cryptocurrencies.
- Consider fees and tax implications when doing so!
- You can use the metrics together or just pick one. Of course, having more indicators could lead to better decisions (or not) but it's also adding complexity to the process.
- You don't have to check these metrics all the time you can actually just sort of 'get a feel' for them. Right now, these metrics indicate that it's a good time to DCA and, if you've been here long enough, I'm sure you'll easily get that same feeling as well.
- Take advantage of Staking and Defi. Since you'll typically be holding crypto for long periods, earning passive income elsewhere is your friend; something active traders can't really take full-advantage of.
- Take advantage of Stablecoins. You can still enter and exit the crypto space without buying/selling cryptocurrencies. You can do this by exiting or entering via stablecoins.
- Depending on your DCA strategy timeframe, regularly buy stablecoins and keep them at an interest-bearing platform: Cefi (Celsius, Blockfi, Nexus, etc.) or Defi (Aave, Compound, Curve, etc.). I do this instead of jumping straight into crypto if I have too much to DCA-in at a time or if it's not a good time to DCA-in.
- By doing so, you're still exposed to high risk; high reward nature of crypto but at relatively low risk. These yields are typically around 6-10% for Cefi and 7%-20% for Defi. You're not exposed to market volatility, just to the coin/platform credibility (obligatory, don't hold USDT).
- When the metric you follow does indicate you should be buying/selling crypto and then trade off of the crypto and stablecoin pair.
This is my way of dollar-cost averaging. I am more data-oriented, so I naturally do lean towards these kind of models. The drawbacks of this strategy is that you're reliant on the accuracy of the metric you use so remember, all models are wrong but some are useful. This is a little bit more complex than traditional DCA, but not nearly as time-consuming as active trading. For the most part, the DCA logic still stands: Time in the market > Timing the market.
tl;dr: DCA-In when long-term metrics show prices are undervalued and DCA-Out when prices are overvalued. Take advantage of defi, staking, and stablecoins.