TA: Ethereum Still Below 100 SMA, Why BTC Is Outperforming ETH
Ethereum is still struggling to gain pace above $2,000 against the US Dollar. ETH price is still below the 100 hourly SMA, while bitcoin surpassed $35,000.
- Ethereum is still struggling to clear the $2,050 and $2,060 resistance levels.
- The price is trading near the $2,000 barrier and the 100 hourly simple moving average.
- There was a break above a key bearish trend line with resistance near $1,950 on the hourly chart of ETH/USD (data feed via Kraken).
- The pair must clear $2,000 and $2,050 to start a strong upward move in the near term.
Ethereum Price is Facing Resistance
Ethereum remained strong above the $1,850 level and it moved higher. More importantly, bitcoin bulls cleared the 100 hourly SMA, opening the doors for a move above $35,000.
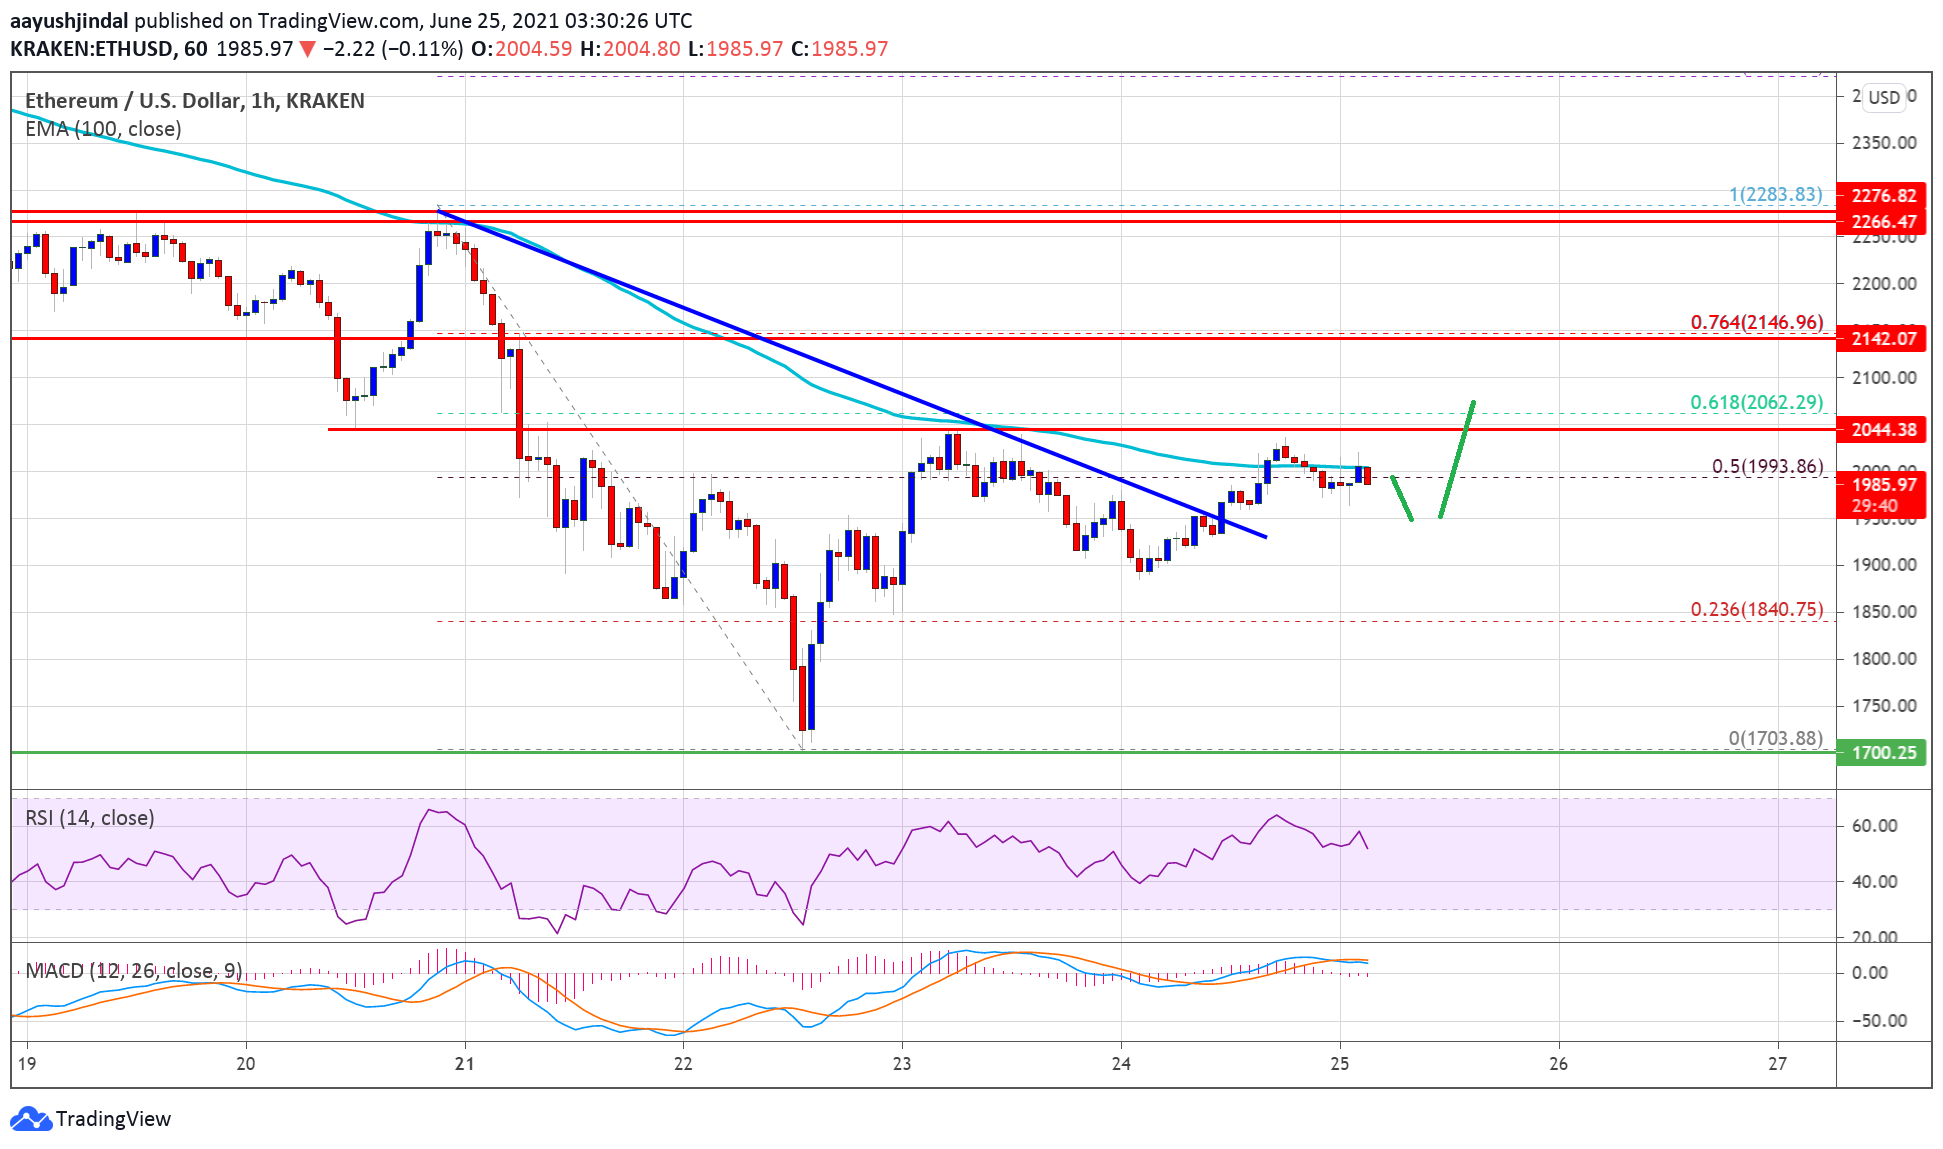
However, ETH price is still facing resistance near the 100 hourly SMA and the $2,000 zone. There was a break above the 50% Fib retracement level of the of the main decline from the $2,283 swing high to $1,700 low.
There was also a break above a key bearish trend line with resistance near $1,950 on the hourly chart of ETH/USD. The pair is now consolidating near the $2,000 zone. The next major resistance is near the $2,050 level. It is close to the 61.8% Fib retracement level of the of the main decline from the $2,283 swing high to $1,700 low.
Source: ETHUSD on TradingView.com
A clear upside break above the $2,000 level and then $2,050 could open the doors for more upsides. The next key resistance is near the $2,150 zone. Any more gains could set the pace for a move towards the $2,300 level. An intermediate resistance could be near the $2,250 level.
Fresh Decline in ETH?
If Ethereum fails to clear the $2,000 and $2,050 resistance levels, it could start a fresh decline. An initial support on the downside is near the $1,900 level.
The first major support is now forming near the $1,850 level. A downside break below the $1,850 zone could lead the price further lower. In the stated case, the price could move down further towards the $1,700 level.
Technical Indicators
Hourly MACD – The MACD for ETH/USD is struggling to gain pace in the bearish zone.
Hourly RSI – The RSI for ETH/USD is currently near the 50 level.
Major Support Level – $1,850
Major Resistance Level – $2,050