Short-term Technical Analysis on Bitcoin
| |
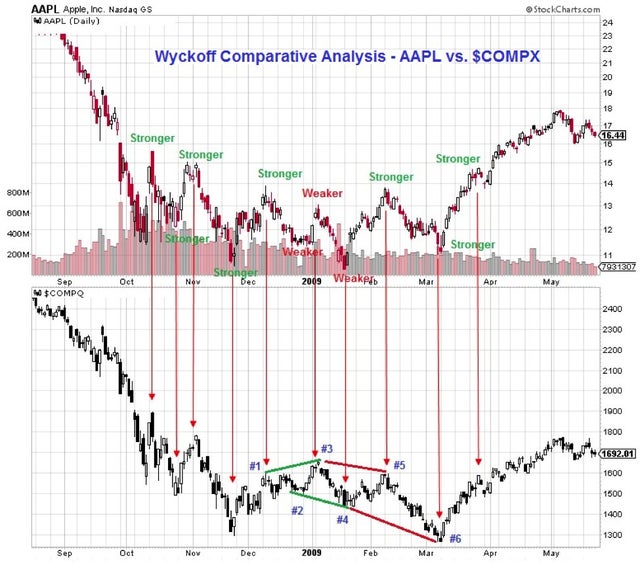
ABSTRACT Bitcoin will consolidate and sit relatively even at its newfound support lines (37.5k USD – 40.5k USD) from a few days to 1.5 weeks at most, before blasting off to reclaim the bull-market support band at around 43k USD – 48k USD. FUNDAMENTAL REASONS Bitcoin is post-Wyckoff distribution, and that is certain from its historical trend (Fig. 1) and textbook reference (Fig. 2). To a great degree of certainty, most distribution patterns of the sort often proceed with an accumulation phase, of which Bitcoin so far as demonstrated (Fig. 3) when compared to a textbook model chart (Fig. 4). If current markers are demonstrated to such a precise degree, there is nothing fundamentally wrong with Bitcoin continuing and completing the trend, which would be to consolidate (meaning stagnant) preceding a major pump. As for why these fundamentals exist in Bitcoin's current market, you must think back to why Wyckoff patterns exist. These hallmark patterns exist due to the presence of market manipulation, where massive institutions and organizations attempt to maximize profits to the detriment of most HODLers and traders because in their capitalistic nature, they aren't here to play charity. Everyone keeps hoping for institutionalized interest, and well, ya got it now. Now think of Elon Musk's tweets, the FUD from WSJ and the alarming block chain analysis of major Bitcoin movements and correlate them to specific timelines of the Wyckoff model. Of course, it makes sense now! These patterns exist because this distribution phase is designed by the path of least resistance to shake off as many traders and bag holders in the profit of institutions. Now onto why an accumulation phase often happens right after a distribution phase. The institutions are simply not done with Bitcoin yet. In a post-distributive phase, these organizations now attempt to keep prices in a channel and repress any major volatility in order to slowly stack up and fill more bags of Bitcoin unbeknownst to the public. This phase is almost always done preceding a major move to the upside. Fig. 1, a representation of Bitcoin's previous trends with Wyckoff distribution markers. Fig. 2, a textbook derivative of Wyckoff distribution (StockCharts, n.d.). Fig. 3, a representation of Bitcoin's recent trend's with Wyckoff accumulation markers. Fig. 4, a textbook model derivative of Wyckoff accumulation (StockCharts, n.d.). TECHNICAL REASONS As of June 14th, 2021, Bitcoin has extremely undersold RSI and stochastic trends, indicative of a imminent market correction that lasts at max a week (Fig. 5). However, our newfound resistance/support level of 38.5k USD and an important psychological barrier of 40k should, with a little bit of luck, keep Bitcoin's price stable enough at 39-40k in order to ramp up buying strength again (Fig. 5). Fig. 5 is also a graph showing specific Fibonacci market resistance lines and time scale lines, showing the immense pocket of support (and resistance) we are currently in. This is further evidence to keep prices stable in the short-term for RSI valuations to get up to speed and top off the accumulation trend with a relief rally. Another reason for a bullish relief rally is due to a specific stock trading pattern (Fig. 6). As shown by the graph, there has been considerable resistance causing consistent lower high's in Bitcoin's recent charts. To have this bit of resistance broken certainly spells good fortune. Just for some quality assurance that I'm not some kind of shill jumping on random trends, I saw this pump coming a long, long way. Fig. 7 was a graph I had drawn on the 3rd of June for a proof of concept idea in order to prove that I saw this coming the long way. Was just busy back testing certain algorithms and barely had time to really work on it until now. Now onto the meat and potatoes. Historical emulations from the 2013 double peak cycle hints on a heavy resurgence or relief rally too before a double peak (Fig. 8), extrapolated from well, the 2013 cycle. As for what fundamental reasons matched the current cycle and what had happened 8 years ago, institutionalized investment and a price advantage variable had caused Bitcoin to hit a logarithmic regression peak, causing an imminent correction. More of this will be explained in further posts. As well, the presence of Wyckoff theorems in both cycles provides the final glue to the notable similarities of these two timelines. The only difference is the accumulation time, where 2013's lasted a few days while our current cycle is sitting at around a couple of weeks. This is the only unexplainable reason, which can be due to an unlucky stochastic RSI shift that made Bitcoin lose a lot of momentum in the current cycle. Again, more of this will be explained in future posts. TO CONCLUDE Heavy market manipulation, strong bullish indicators, and overall a bullish sentiment shown! Institutions are in the game now, and your now in their sandbox! If you like this content and want more of it, I'll be happy to provide! In this space, we all have the right to good content. Happy trading folks! Disclaimer: I am not a licensed financial advisor nor does this content attempt to replicate any of the sort. This content is listed strictly for entertainment and educational purposes. When in doubt, contact a professional. Your money, your problem. References or pictures unoriginal to me StockCharts. (n.d.). The Wyckoff Method: A Tutorial. StockCharts. Retrieved from https://school.stockcharts.com/doku.php?id=market_analysis:the_wyckoff_method Edit: Typo on figure numbers submitted by /u/Nervous_Sky_5167 |